Japanese candlestick trading is one of the most popular ways of forex. No matter what type of trading strategy you follow, these candlestick pattern charts can provide you with much useful information to predict future price action.
Different types of candles and candlestick patterns can make you think understanding them is complicated. But this is far from the truth. However, you need to make sure you are learning about them from the very beginning and in the right way.
So to help you get started, we created this Japanese candlestick trading guide which covers the basics of Japanese candlestick trading.
For a trader to be successful, they need to accurately speculate on the price direction in the market. Since just guessing the price fluctuations is not good enough, traders use both fundamental and technical indicators to do their guesswork for them.
Among the several technical indicators, Japanese Candlestick charts are some of the most widely used indicator patterns.
Japanese Candlestick patterns are a type of technical indicator tool that signals asset price movements with the help of candlesticks on a chart. With these, traders can analyze and chart the opening, closing, high, and low-price points for each given period. Apart from that, the price movement indications are shown in the chart depending on the past patterns of the same asset.
Even with the availability of High-Low Open Close (HLOC) charts, technical traders tend to lean more toward the Japanese Candlestick charts. The main reasons behind this are their easy readability and faster analysis. In addition, the flexibility of being able to use it in any timeframe is also a plus.
Japanese Candlestick patterns track asset price movements by displaying candles for each period. Further, these past candles, when combined, form patterns that inform traders with clues on where a market’s headed next. Understanding these patterns is the way traders can speculate on market movements with ease.
Japanese candlesticks are a technical indicator tool that dates back to the 17th century. During this period, Japanese rice farmers started using technical analysis to help their rice trades. The origin of the candlestick patterns is still a mystery, even though there are lots of signs pointing toward the legendary rice trader Munehisa Homma as the creator of these patterns.
The original idea of the Munehisa Homma stood the test of time and was reinvented to suit the current market environment. The Candlestick patterns of Homma made their way to the US around 1850. And with their help, journalist Charles Dow was able to further develop the price action and the technical analysis tools.
When talking about the history of price action, we have to talk about Charles Dow a bit more. Not only was he a journalist at that time, but he was also the founder of the renowned Wall Street Journal. Furthermore, he also is the founder of the Dow Jones Industrial Average.
Another important figure in the history of Japanese Candlesticks is Steve Nison. He is the one that wrote about it and introduced the candlestick patterns to the western world, and gave them the name "Japanese Candlesticks". So if not for Steve Nison, we might not even have heard about it.

Since now you know about what Japanese candlesticks are and their history, it is about time we dive deeper into the topic. To read and understand a candlestick pattern, first, you must know the anatomy of the candlestick.
Each part of the pattern depicts different information. So understanding them is the key to making the best use of them in your trading. To make the process of understanding a little bit easier, let's refresh our memory on the components of a candlestick.
Body: Indicates the opening and closing prices of the asset. In a bullish market, the close will stay above the open, while in a bearish market, the open will stay above the close.
Shadow/wick: Indicates the intra-day high and low points of the asset price. If the high or low coincides with the open or closing prices, shadows become invisible.
Color: Indicates the market direction of the asset. Green or white color signals a price increase, while a black or red color signals a decline in the price.
Now let's move on to the Japanese Candlestick patterns.
By observing the above two diagrams, you can see that there is a bullish green candlestick and a bearish red candlestick. The green bullish Japanese candlestick closes higher than where it originally opened. On the other hand, the red bearish Japanese candlestick closes lower than where it originally opened.
When observing a candlestick pattern information of a market in a certain period of time, you will be able to notice that the market doesn’t always open exactly where it closed in the previous session.
The reason behind this is the events that occur over the weekend when the forex market is closed. This instant price fluctuation can be harmful to traders. Thus traders tend to avoid holding positions over weekends.
Important: The flexibility that comes with Japanese candlesticks allows them to be used in any given timeframe. Even if you use the Japanese candlestick on a daily or hourly chart, the output will always be a collection of bullish and bearish candles.
Japanese Candlestick charts are very good at providing a graphical representation of the price movements within the market. With their help, traders can get an insight into the supply and demand behind the asset price action. There are lots of things that a trader can calculate just by observing a Japanese Candlestick pattern.
As you know by now, a green candlestick shows a bullish price action, while a red candlestick shows a bearish price action. Moreover, in cases where the shadow is taller than a long-bodied candle, it indicates high market volatility, with bulls having the edge.
For another instance, if a candle comes with a short red body with a long upper shadow, it depicts a bull-driven market price that was beaten back by bears before close. Further, when the shadow is invisible, it signals a high open price and a low closing price.
By examining these candlesticks for a long time, traders have come up with various patterns that follow various market behaviors. These allow traders to accurately predict market movements, may it be a reversal, continuation, or pause.
Keep in mind that various candlestick patterns come with a different number of candles with it. When considering this aspect, there are three types of candlestick patterns single, double, and triple.
When considering these types of patterns, there are a few that show up more on charts than the rest. If you want to become a technical trader, understanding these and what they mean can help you in many more ways than one. Here are some of the patterns every trader should know about.
This pattern has the same open and close prices as depicted by its candle. These show up as very thin lines that are typically less than 5% of the total range of the period. Doji patterns indicate indecision within the market.
Dragonfly Doji patterns form when the open and close prices of an asset are at the high of
the given period. When this shows up in the market, it signals the probability of an uptrend reversal.
This type of pattern forms when a downtrend comes to an end while beginning a bullish reversal. The Hammer comes with a small body and no upper shadow. But the lower shadow tends to be much longer than the body.
It is a bearish reversal candlestick pattern that is formed when the open, low, and closing prices are close by. This comes with long upper and lower shadows, making it look like a gravestone, as the name suggests.
These appear when there is a bearish control present in the market. The closing price of the Bearish engulfing pattern is below the opening price. This is a double candle pattern and has a long bearish candle that completely engulfs the previous candle.
These appear when there is bullish control in the market. The closing price of the Bullish engulfing pattern is higher than the opening price. This is also a double candle pattern and has a long Bullish green candlestick that completely engulfs the bearish candle prior.
The first step in using the Japanese candlestick patterns is understanding everything that there is about them. The more you know about different patterns, the easier it is for you to speculate on the direction in which the market is heading.
If you have any doubt about your ability to read candlestick patterns, try using a demo account to test out the patterns and charts to see if your predictions are accurate.
When you have enough confidence in yourself that you can implement these patterns in your trading, open up a trading account and start trading. When done correctly, you will see a clear difference between before and after the candle implementation.
Pro Tip: Use another indicator tool to confirm your findings from the Japanese candlestick patterns. This way, it will leave even smaller room for error.
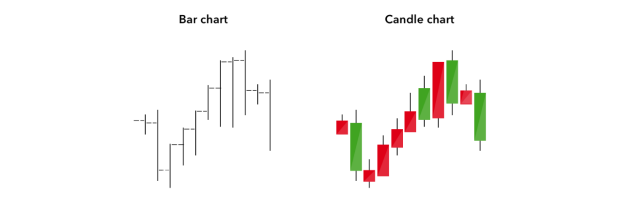
The only major difference between the bar charts and the Japanese candlesticks is their graphical representation. Both of these types of charts tend to express the same information to the traders.
However, with Japanese Candlestick charts, traders can get a clearer idea about the price action than with a bar chart. They also are able to graphically demonstrate the supply and demand factors that affect the price movements.
In addition, while bar charts are just lines, candlestick patterns have bodies that indicate a certain period. Many believe that the lack of a thick body allows bar charts to be a bit more precise than a Japanese candlestick pattern.

When comparing the Japanese candlestick patterns with Heikin Ashi patterns, they both are formed with the help of open, close, high, and low prices.
However, the main difference between the two is that Heikin Ashi candles tend to be smoother as it is an average version of Japanese candlesticks.
Just like the Japanese candlesticks, Heikin Ashi also uses the data of the previous bar to produce the current candle's open price. Moreover, Heikin Ashi patterns display more consecutive-colored candles.
Also, when displaying the open and close prices, Heikin Ashi candlesticks start from the MIDDLE of the candlestick before it, unlike the Japanese candles.
The legendary rice trader Munehisa Homma is the creator of candlestick patterns. The credit for spreading it in the western world goes to Steve Nison.
Though not 100% accurate, Japanese candlesticks provide a good idea of the price direction. To confirm the information you get from the candlestick pattern, you can use another indicator.
What's better between Heikin Ashi charts and Japanese candlestick patterns depends on personal preferences. While Japanese candlesticks show market movements, Heikin Ashin offers an average version of it.
Using all the tools at your disposal is the best way to become a forex trader that can stand the test of time. Analysis tools, signal providers, and indicator tools can allow you to make price speculations that have a higher chance of success.
Among the countless tools, traditional Japanese candlestick charts take a special position as it is the basis for many other indicator tools. With the correct understanding of candlestick patterns, you will have a deeper understanding of the market patterns, and the way prices tend to fluctuate.
As with anything else, make sure to do your research as best as you can before incorporating candlesticks patterns into your trading strategy. That way, you can stay a step ahead of the competition and make more accurate predictions.
 Copyright © 2024 IconFX