Trading with Heikin Ashi candles is a popular trading strategy traders use whether they are into the day trading or swing trading.
They are a reliable charting pattern and also a technical indicator that you can use to understand the price movement and predict future movement accurately.
With Heikin Ashi candles, you can determine trends as well as trend reversals in financial markets. If you are interested in short-term trading strategies, you must learn about these candlestick patterns.
Lucky for you, you can start learning about them right here in detail. In this article, we cover it all from what is Heikin Ashi candles, how to read them, and how to use them in trading.
Heikin Ashi is a technical indicator tool that uses the widely popular Japanese candlestick formations. This type of technical indicator uses candlesticks as a way to depict the price movement in the market.
In addition, the Heikin Ashi candles use the market averages to filter out market noise, resulting in an accurate output. With the displayed information, traders can identify the trends easily and speculate on the price direction more accurately.
Father of price action and the creator of candlestick charts, Munehisa Homma, is the figure behind the Heikin Ashi candles as well.
While this method shares some similarities with the classic candlestick charts, it differs in the candlestick value calculation. Moreover, the Heikin Ashi pattern utilizes a modified formula based on two-period moving averages, unlike the traditional candlesticks.
Because this technique eliminates market noise, determining the price direction becomes much easier. Furthermore, it also helps traders to understand the perfect time to trade, pause trades, or even to identify a price reversal.
As we discussed earlier, Heikin Ashi candles are a type of price action chart that uses averages to calculate the price movement.
Like the traditional candlestick patterns, this type of candle also shows four price levels —Which are the
What's special in this case is that it employs data from the current and prior sessions to derive their values.
If you want, you can use both the traditional candlestick and the Heikin Ashi candles at the same time for a short-term trade favorable result. When compared side to side with traditional candlesticks, this type of pattern tends to provide a smoother pattern with less market noise.
For the calculation of the Heikin Ashi formula, use the previous period's open-close data and the current period's open, high, low, and close data. So traders can apply this pattern to any time frame and get results accordingly. Updated versions of these values are shown as candlesticks, and the formula is as follows.
When compared with their traditional counterpart, Heikin Ashi candles offer a bit more. While they both might look similar, they often have their own benefits and drawbacks.
Here are some of the benefits that traders can enjoy while using the Heikin Ashi pattern.
Unlike the traditional candlestick patterns, this chart goes the extra mile and filters out the market noise. It does this by reducing small corrections, thus making the signals more transparent.
When the traders have a transparent overview of the market, they can plan their entries and exits more accurately.
It is a well-known fact that to get a more accurate signal, you will have to use other indicators as confirmation tools. The great thing about Heikin Ashi candles is that they are very compatible and work well with other technical indicators.
This pattern is one of the easiest charts to read and understand without any outside help. Moreover, traders can quickly identify market trends and take necessary actions quickly with the help of the Heikin Ashi candles.
The Heikin Ashi pattern comes built-in to MT4 platforms. Traders who want to use this pattern do not have to follow any extra installation steps.
Just like the traditional candlesticks, Heikin Ashi candles also come with three main aspects, the body, shadow/wick, and color. To get an understanding of the marketplace price movement, traders will have to pay attention to each of these aspects.
Each of the aspects depicts different information, and below is how you can read the Heikin Ashi candles.
With the help of the Heikin Ashi candles' indicator signals, traders can get information about the current trend in the market.
There are two main aspects of indicator signals with this type of pattern. They are the trend strength and the trend reversal.
Let’s talk about each of these aspects in more detail.
Trend strength is something that Heikin Ashi candles pay a lot of attention to. Due to the smoothing effect of the chart, traders might not be able to identify small consolidations and corrections.
Therefore, it is recommended that you use a trailing stop to widen the rewards of trading within the trend. Moreover, if the strength is high, traders should consider staying in the trend to profit more from it.
With the help of trend reversal indicator signals, traders can get a better understanding of the entry and exit of trade positions — Especially when to exit a previous trend-following trade and when to enter a new trend.
When the trader can get early insight into the trend reversal, they can enter a more profitable trend to prevent losses.
While we are talking about the strength and the reversal of trends, it is important to understand the type of trends within the Heikin Ashi candles.
They are,
There are a few trend reversal patterns that every trader should be aware of when it comes to Heikin Ashi candles. They are as below.
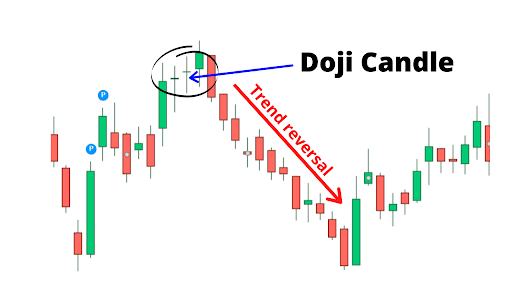
The appearance of a Doji candle after an uptrend indicates market indecision where bulls are still decisive. You also can interpret these as a sign of supply and demand reaching an equilibrium.
In both scenarios, the Doiji candle signals that the uptrend is coming to an end.
The abandoned baby is a reversal pattern with three candles. The first candle is a long-bodied down candle and shows the direction of the current trend.
The second is a Doji candle in the direction of the trend, and the price gap at the open, above, or below the close of the day prior. Its shadow cannot overlap with the candle before or after. The final candle has a long body, and its price gap is opposite to the direction of the current trend.
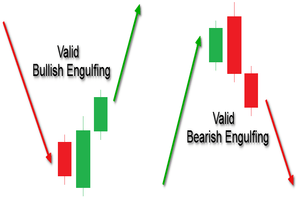
When an engulfing pattern forms in the market, it signals a major reversal at market extremes. There are two types of engulfing patterns in the market. They are,
Signals a downtrend reversal and the rise of buying pressure when forming at the bottom of a downtrend. This has two candles, one small red one and a big green one. The larger green bullish candle engulfs the previous smaller bearish red candle.
Signals an uptrend reversal and the rise of buying pressure when forming at the top of an uptrend. This has two candles, one small green one and a big red one. Here the larger red bearish candle engulfs the previous smaller bullish green candle.
Traders can utilize the Heikin Ashi candles in many ways to capitalize on the indicator signals that it provides. This wide flexibility is also unique to the Heikin Ashi, unlike the traditional candlestick patterns. Let’s look at how you can use Heikin Ashi patterns in trades.
Here are some of the most commonly used Heikin Ashi Strategies.
This strategy is to identify the beginning of a strong uptrend or downward trend, and this is the most commonly used strategy for Heikin Ashi candles.
This allows traders to hop on the trend and increase profits. When the bullish trend emerges, long position traders tend to consolidate their positions while short position traders tend to exit.
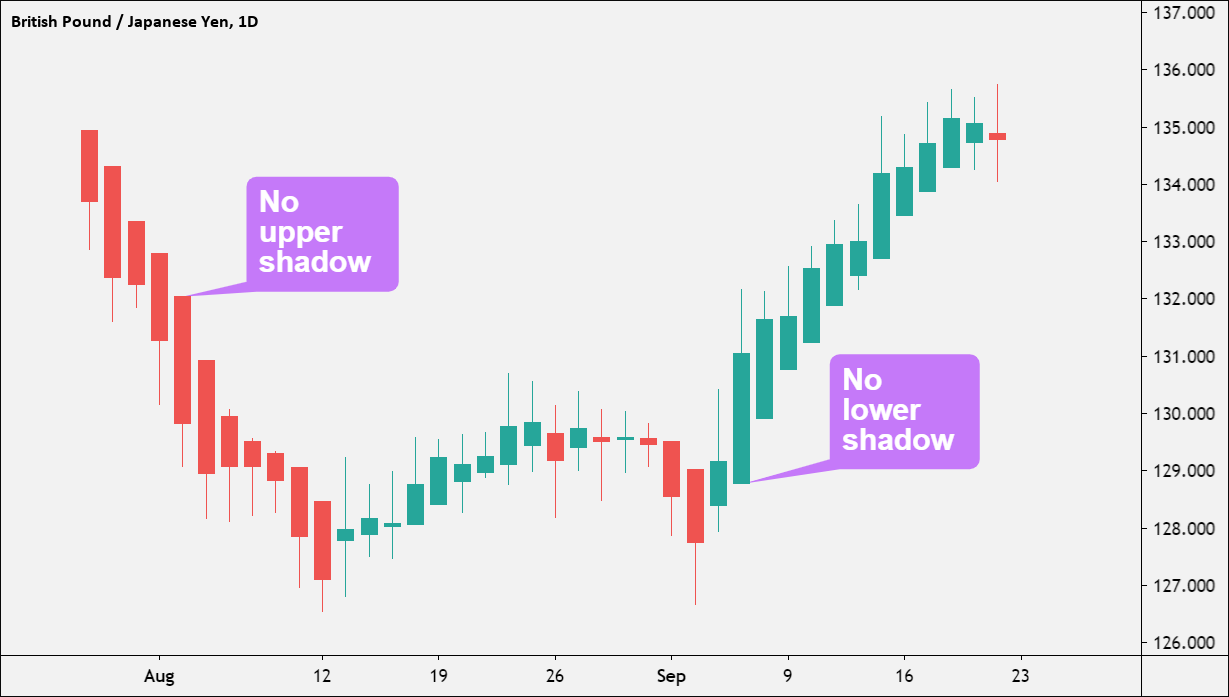
When a trader can identify a candle without shadows, it usually means that there is a high probability of a bullish trend starting. When the sequence of candles without shadows is extensive, the trade profitability also rises.
If the Heikin Ashi candles show a candle without an upper shadow, it signals the probability of a new bearish downtrend.
When the pattern displays small body candles, it indicates a high probability of a trend pause or a reversal. When this occurs, traders tend to open new positions with the new trend in mind.
As with anything, Heikin Ashi candles are also not perfect in every regard. Even though the benefits outnumber the limitations, it is important to understand their downsides as well.
While the Heikin Ashi pattern signals market price trend movements, it cannot indicate price gaps. But traders can counter this with the help of traditional candlestick patterns.
Due to this pattern usage of historical market price data, the calculation might take some time. This can, in turn, cause the chart to be laggy.
Heikin Ashi candles do not show actual open and close prices due to their usage of averaged data. This can cause some issues with a certain group of traders.
Heikin Ashi candles are one of the easiest-to-read and easy-to-understand patterns that traders can use. Correct usage of this pattern can help traders identify market reversals and to decide what to do next.
Below is a boiled-down version of how to trade with the Heikin Ashi pattern.
Multiple red candles without upper shadows indicate a strong downtrend. In this case, stay short until the candlestick changes to green or till the appearance of upper shadows.
Heikin-Ashi is a candlestick pattern approach that tries to decrease market noise by producing a chart that indicates trend direction better than traditional candlestick charts. The word Heikin-Ashi means the “average bar” in Japanese, and this pattern was introduced by Munehisa Homma.
Heikin-Ashi is more advanced than traditional candlesticks and has a smoother appearance since it takes an average of the movement. However, this smoothening effect makes it difficult to identify small consolidations and corrections in the price movement.
Heikin-Ashi is a very dependable indicator that produces accurate findings. It makes use of historical data, which is also extremely reliable.
Just as traditional candlesticks, Heikin Ashi candles offer insights into the trend direction of the price movement.
However, they are more advanced than regular candlestick charts and showcase the smoothened volatility of a currency pair, allowing you to construct more advanced trading techniques.
So just as traditional candlestick patterns, every trader must know their Heikin Ashi candles which will come in handy in their trading endeavors.
This article is to help you and your trading career by teaching you about one of the best technical indicators in the market.
Do your research about the Heikin Ashi candles and select a platform that supports those indicators, like Icon FX.
 Copyright © 2026 IconFX