Oil Prices Rise Again as Iran Tensions Threaten Strait of Hormuz
Table of Contents
Oil Prices Rise Again as Iran Tensions Threaten Strait of Hormuz
Oil markets are facing renewed uncertainty as oil prices rise again following fresh concerns over Iran tensions and potential risks surrounding the Strait of Hormuz. The latest move higher has placed crude oil back in focus as traders evaluate whether geopolitical developments could create further disruption across global energy markets.
The rebound comes as investors reassess supply risks in one of the world’s most important oil regions. With the Strait of Hormuz playing a critical role in global energy transportation, any increase in tensions can quickly influence crude oil prices, inflation expectations, and financial market sentiment.
Why Oil Prices Rise Again Amid Strait of Hormuz Concerns
The main reason oil prices rise again is the return of geopolitical risk. The Strait of Hormuz remains a major trading route for crude oil shipments, and any threat to shipping activity can increase fears of supply shortages.
Energy markets often react before an actual disruption happens. When traders believe supply risks are increasing, they typically price in a higher risk premium, causing benchmarks such as Brent crude and WTI oil to move higher.
The latest oil prices rise again move shows how sensitive energy markets remain to global events. Even when production levels remain stable, uncertainty surrounding major oil-producing regions can create sharp price movements.
For traders following the crude oil forecast 2026, geopolitical developments remain one of the biggest factors influencing the oil price outlook.
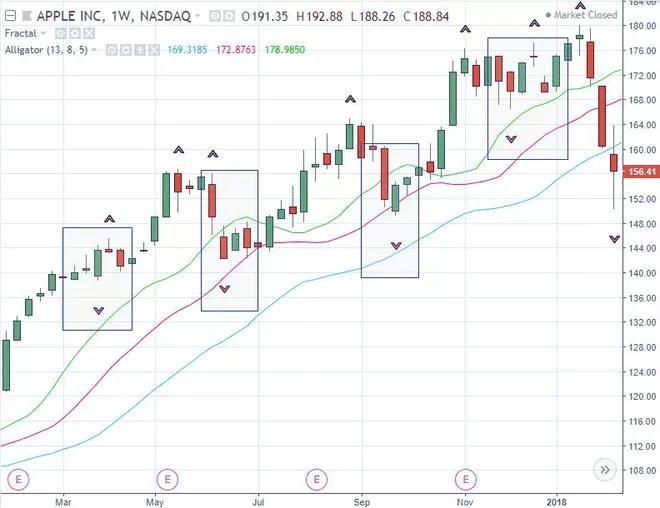
Crude Oil Chart
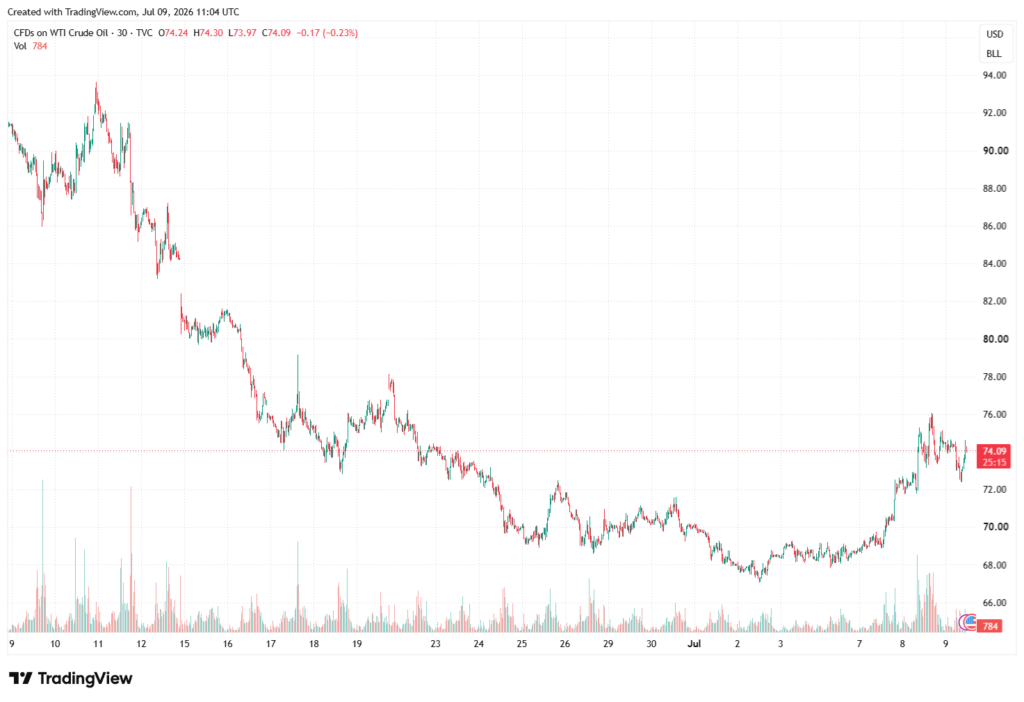
Data shown is accurate as of 9 July 2026. Past performance does not guarantee or predict future results. This content is provided for informational purposes only and does not constitute financial advice, investment advice, or a recommendation to buy, sell, or trade any financial product.
Strait of Hormuz Risks Keep Oil Traders Alert
The Strait of Hormuz has consistently been one of the most closely watched locations in global energy markets. A significant share of global oil supplies passes through this narrow waterway, meaning any disruption could have a major impact on international markets.
As tensions involving Iran continue to attract attention, oil prices rise again because traders are considering the possibility of reduced supply availability. Even the possibility of delays or restrictions can influence expectations for future oil prices.
A prolonged increase in geopolitical uncertainty could push Brent crude prices higher and create additional volatility across commodities. However, if tensions ease, some of the recent gains could reverse as traders shift their attention back to production and demand factors.
How Higher Oil Prices Could Affect Forex Markets
The impact of oil prices rise again extends beyond commodities. Rising crude prices can influence currency markets, especially currencies connected to energy exports and imports.
The Canadian dollar is one currency that often benefits from stronger oil prices because Canada is a major energy exporter. If crude oil maintains its upward momentum, commodity currencies could receive additional support.
Meanwhile, higher energy costs can create challenges for oil-importing economies. Increased fuel prices can contribute to inflation pressures and influence expectations around central bank decisions.
The US dollar may also react as investors look for safe-haven assets during periods of uncertainty. At the same time, higher oil prices can affect inflation forecasts and expectations for future Federal Reserve policy.
Oil Market Outlook: Can the Rally Continue?
The next phase for crude oil will depend heavily on how geopolitical risks develop. If concerns around Iran and the Strait of Hormuz continue, oil prices rise again could become a longer-term trend rather than a short-term market reaction.
Traders are monitoring several important factors, including global oil inventories, OPEC+ production decisions, economic growth expectations, and demand forecasts from major economies.
The current oil prices rise again movement highlights the importance of understanding both technical and fundamental analysis. While geopolitical events can create sudden price swings, longer-term trends will depend on supply, demand, and global economic conditions.
For those tracking the oil price forecast, volatility is likely to remain elevated as markets respond to new developments.
What Traders Should Watch Next
The latest oil prices rise again trend has placed several key market indicators in focus:
- Developments surrounding Iran and the Strait of Hormuz
- Brent crude and WTI oil price levels
- Global inflation expectations
- Central bank policy decisions
- Energy demand forecasts
- Currency movements linked to commodity markets
As uncertainty continues, oil prices rise again remains a major theme influencing global financial markets. The relationship between oil prices, inflation, and forex volatility will remain important for traders watching the next major market move.
With geopolitical risks returning to the energy sector, oil prices rise again reflects how quickly global events can reshape market expectations. Traders will continue watching whether the current rebound develops into a sustained oil rally or fades as tensions improve.
With the Strait of Hormuz remaining a major focus, oil markets are likely to stay sensitive to every new geopolitical development. Traders can stay updated with breaking market news, analysis, and free forex signals via the Icon FX Telegram channel.
Start Trading With Icon FX
Ready to explore the markets and put your trading knowledge into practice? Open a FREE demo account with Icon FX and experience a realistic trading environment using professional trading tools, competitive conditions, and market insights designed to support your trading journey.
Whether you are following oil price movements, forex trends, or global market opportunities, a demo account allows you to familiarise yourself with the platform and develop your trading approach before committing real funds.
Start your trading journey today with Icon FX and open your FREE demo account.