Contact Us
FAQs
Start Trading
Start Trading

S&P 500 Hits All-Time High: What Traders Should Actually Learn From This Move (April 2026)

Posted
April 16, 2026
S&P 500 Hits All-Time High

S&P 500 Hits All-Time High: Market Context

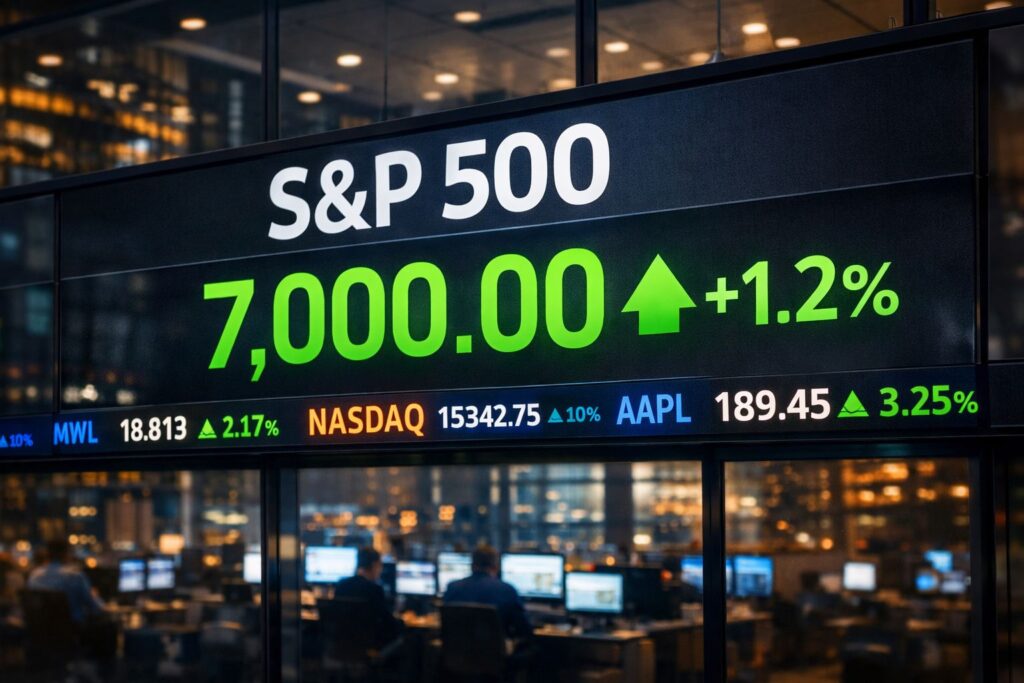
The S&P 500 Hits All-Time High, breaking above the 7,000 level for the first time in history and extending its long-term bullish structure.

As of April 16, 2026, the index trades near 7,022, with data from TradingView, Investing.com, and macro tracking from FXStreet confirming continued upside momentum.

From an educational trading perspective, this move is not just about “price going up.”

It’s about why price is going up and what type of market phase we are in.

Lesson 1: Markets Don’t Move on News — They Move on Positioning

One of the key takeaways from the S&P 500 Hits All-Time High environment is this:

Markets are not reacting to headlines anymore — they are reacting to positioning.

Even with geopolitical uncertainty still present, price continues higher because:

  • Traders were already positioned for downside
  • Systematic strategies are re-risking
  • Momentum models are reinforcing the trend

This is a classic flow-driven market, not a pure fundamental one.

Lesson 2: Index Moves Are Increasingly Concentrated

Although the S&P 500 Hits All-Time High, not all stocks are participating equally.

Data from TradingView shows that a large portion of gains comes from:

  • Mega-cap technology
  • AI-related stocks
  • High-liquidity growth names

This creates an important concept:

Index strength ≠ market breadth strength

For traders, this is critical because narrow leadership often leads to:

  • Higher volatility later
  • Sharper corrections
  • False sense of stability

Lesson 3: Geopolitical Risk Is Not Gone — It Is Deferred

The S&P 500 Hits All-Time High, partly because markets are pricing in reduced geopolitical risk, especially around Iran-related tensions.

However, from a risk-management perspective:

Deferred risk is not eliminated risk.

Markets are currently assuming:

  • Controlled escalation
  • Stable energy supply
  • No major supply shocks

This assumption reduces volatility in the short term — but increases sensitivity to surprises.

Lesson 4: Volatility Compression Signals Expansion Risk

One of the most important educational signals in this environment:

  • Volatility is compressed
  • Trend is extended
  • Participation is narrow

Platforms like Investing.com show subdued volatility pricing despite macro uncertainty.

Historically, this combination leads to:

Sudden volatility expansion phases

Not necessarily a reversal — but faster and less predictable price movement.

How Traders Should Interpret This Phase

When the S&P 500 Hits All-Time High, traders should avoid one-dimensional thinking.

Instead, classify the environment correctly:

Current Market Type:

  • Momentum-driven uptrend
  • Liquidity-supported structure
  • Narrow participation
  • Low volatility regime

What This Means:

  • Trends work well, but reversals are sharp
  • Breakouts can extend further than expected
  • Risk management becomes more important than prediction

What Most Retail Traders Get Wrong

In this type of environment, common mistakes include:

  • Chasing highs without pullback structure
  • Ignoring index concentration risk
  • Overestimating macro stability
  • Underestimating volatility expansion potential

The S&P 500 Hits All-Time High environment rewards trend participation — but punishes late entries.

Key Trading Lesson

The most important takeaway is simple:

In liquidity-driven markets, price is not a reflection of safety — it is a reflection of positioning.

That distinction separates consistent traders from reactive ones.

Trade Smarter With Institutional-Style Market Insight (Icon FX)

At Icon FX, we focus on helping traders understand not just what is moving, but why it is moving — especially when the S&P 500 Hits All-Time High in structurally complex conditions.

If you are actively trading indices like the S&P 500 or Nasdaq, this environment makes broker selection and execution quality critical.

Start trading with us today: https://portal.iconfx.com/register/

📩 For market insights, broker guidance, or trading support:
[email protected]

Market Resources

  • TradingView — technical structure and price action
  • Trading Economics — macro fundamentals
  • FXStreet — sentiment and global flows
  • Investing.com — live pricing and volatility data

Final Takeaway

The S&P 500 Hits All-Time High, but the real lesson is not about the breakout itself.

It is about how fragile and concentrated the structure behind it has become.

For traders, this is not a signal to blindly buy strength — it is a reminder to understand:

  • What is driving the move
  • Who is participating
  • And what happens when positioning shifts

Because in markets like this, timing matters — but structure matters more.

Ready to Start Trading?

Open an account in 3 minutes and receive your login details instantly.
Copyright © 2026 IconFX
Icon FX is a trade name of Icon Tech PTY Ltd, a limited company registered in Australia authorised and regulated by the Australian Securities & Investments Commission (ABN 94 650 709 265)

Here at Icon FX we want to expand our positive influence beyond the financial sector. That’s why when you trade with Icon FX we commit a portion of our revenue to supporting world-leading projects like Ocean-Bound Plastic Clean-up and Mangrove Tree Planting. See more info here https://verdn.com/
Risk Warning: Trading foreign exchange on margin carries significant risks, and may not be suitable for all investors. The high degree of leverage can work against you as well as for you. Before deciding to trade foreign exchange you should carefully consider your investment objectives, level of experience, and risk appetite. The possibility exists that you could sustain a loss of some or all of your initial investment and therefore you should not invest money that you cannot afford to lose. You should be aware of all the risks associated with foreign exchange trading, and seek advice from an independent financial advisor if you have any doubts. With the demo account you can test any trading strategies you wish in a risk-free environment. Please bear in mind that the results of the transactions of the practice account are virtual, and do not reflect any real profit or loss or a real trading environment, whereas market conditions may affect both the quotation and execution. A Disclosure Document is available here. Information about our services, including our fees and charges is also available at those sources.