Pennant patterns are used to predict the future market movement across many markets. Once you read this Pennant Guide, you will know how to identify and trade with this pattern.
Having a good understanding of all of the chart patterns is vital for your success as a forex trader. These patterns are the key to accurately predicting asset price movements and trends within the market. Pennant is one of these key chart patterns that you can use in your forex trades.
In this Pennant guide, we will take a deeper look at the Pennant pattern and its characteristics.
Pennant is a type of continuation chart pattern that tends to form after strong trend moves. Traders tend to go into consolidation after a big uptrend or a downtrend. Due to this trader consolidation, the price also usually consolidates and forms small symmetrical triangles. These are the patterns that we call Pennants.
The converging trend lines of the Pennant triangle contain information about the price action. These also have the potential to form under both bullish and bearish conditions in the market. We'll talk more about bullish and bearish patterns in this Pennant guide in a bit.
When compared with most of the other chart patterns, Pennants tend to be more reliable at providing accurate information. So with correct implementation, Pennants can offer traders a solid risk/reward ratio to benefit from.
A forex market is a place where traders do not gain access to information about accurate market volumes. When traders who prefer the underlying trend of the market trade enter the market, they can use momentum indicators along with the Pennant patterns to get a better understanding of the price chart and when to trade.
However, on markets like stock, where the traders can see the volume figures clearly, Pennants alone can help them to analyze the breakout.
Identifying a Pennant pattern on a chart is not a hard task. They are fractal in nature and can appear at all degrees of trend. With the possibilities of potential breakouts, accurately spotting a Pennant pattern becomes important.
Since it's important to understand Pennant patterns early, the next section of our pennant guide focuses on its key characteristics. There are three main characteristics that anyone can spot when looking at these patterns. They are,
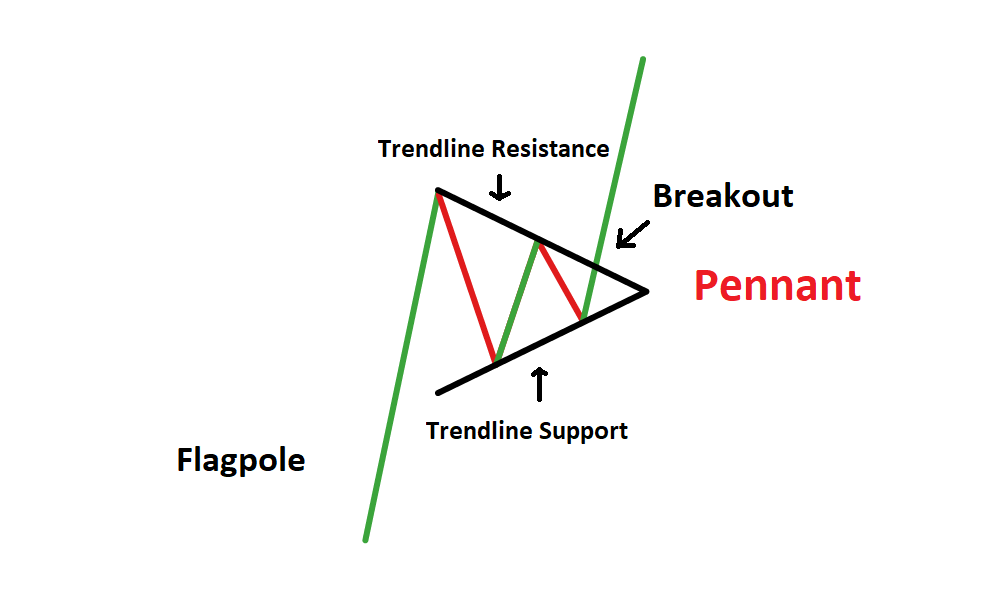
Flagpole: When a pennant pattern appears, it always begins with a flagpole. This flagpole is what differentiates pennants from other patterns like the symmetrical triangle. The initial strong move preceding the symmetrical triangle is what the flagpole represents.
Breakout levels: Every pennant pattern has two breakout levels. One breakout is at the flagpole end. And the other is after the consolidation period, where the uptrend or the downtrend continues.
Pennant: When the market consolidates, it creates a triangle between the flagpole and the breakout. This is the pennant. The two converging trend lines from the flagpole and the breakout levels form the triangle.
As you know by now, with this pennant guide, pennants appear after consolidation periods. In the case of a bullish pennant, it is a bullish continuation pattern that signals the extension of the uptrend at the end of consolidation.
When we take a look at the characteristics of the bullish pattern, we can see some clear differences from the bearish pennant. On the flagpole front, the bullish version shows a series of higher highs and higher lows. The pattern activates when there is an upper trend line while a break of the supporting line invalidates the pattern.
The bullish pennant, just like the bullish flag, comes with two phases which are a strong uptrend and consolidation. But unlike in the flag, the consolidation of the pennant takes the form of a triangle. If the consolidation phase does not start from an uptrend, it is not considered a bullish pennant.
The asset price usually starts to consolidate below the highs after the establishment of a short-term peak. Until the two converging lines connect the higher lows and the lower highs, they keep going. When this happens in a chart pattern, it indicates a certain breakout.
Just like any other continuation pattern, the bullish pennant also helps the uptrend to reach higher. Since the pennant makes it easier to identify the trade stage, traders can easily trade the pennant.
The correction at the end is also important here. It indicates a stronger uptrend and the final breakout as the correction gets smaller.
The biggest drawback of a bullish pennant is its dependence on consolidation formation. The time it takes to form a consolidation can be long and undependable. Within this time, there is the possibility of reversals forming in the trend. So, the best cause of action is to enter the trade before the breakout occurs.
When we are talking about a bearish pennant, it is a bullish continuation pattern that signals the extension of the downtrend at the end of consolidation.
When we take a look at the characteristics of the bearish pattern you can see some clear differences from the bullish pennant. On the flagpole front, the bearish version shows a series of lower highs and lower lows. The pattern activates when there is a lower trend line while a break of the supporting line invalidates the information.
The bearish pennant, just like the bearish flag, comes with two phases which are a strong downtrend and consolidation. But unlike in the flag, the consolidation of the bearish pennant takes the form of a triangle. If the consolidation phase does not start from a downtrend, it is not considered a bearish pennant.
The asset price usually starts to consolidate below the lows after the establishment of a short-term low. When the sellers are able to secure a breakout, it ends the consolidation period.
When the pattern shows that the upper and lower trend lines are converging, it means a breakout is about to follow. This does not occur in the bearish flag, as the consolidation can last for a long time.
Just like any other continuation pattern, the bearish pennant also helps the downtrend to reach even lower. Since the bearish pennant makes it easier to identify the trade stage, traders can easily trade the pennant. The correction at the end is also important here. The smaller the correction is, the stronger the downtrend and the final breakout usually is.
The biggest drawback of a bearish pennant is its dependence on consolidation formation. Just like the bullish pennant, this also can take a long time to form a consolidation.
Within this time, there is the possibility of reversals forming in the trend that can affect the trades. So, the best thing to do is to enter the trade before the breakout occurs.
With the help of this pennant guide, we hope that you now have a deeper understanding of the pennant. But that alone won't cut it. To become a good trader, you will need to devise a strategy that works.
Since pennant is a continuous pattern, it should not retrace more than 50% of the previous price leg. If this value breaches the 50% threshold, there is only a small chance for a rebound in the direction of the prior trend. Besides these, there are a few rules that make up a viable pennant strategy.
When entering a long position,
When applying the same strategies to a short-term position, all you have to do is follow the above steps in reverse. That will set the perfect strategy to make short-term trades more profitable.
The good thing about pennant patterns is that trading using either the bullish or the bearish is similar and the same approach works on both of them. The only difference here is while bullish pennants will have a long bias, the Bearish Pennants tend to have a short bias.
After a sharp move in the asset price, the pennants indicate a high probability of a breakout and a continuation of the trend in the same direction. This is the perfect opportunity for traders to enter a trade.
When placing stop losses, the ideal location is the low of the breakout candle. Because the forex market is highly volatile, taking risk management steps like this is very important.

Both flag and pennant patterns are continuation patterns with few small differences among them. The most obvious difference is the shape of the two patterns. While the pennant displays a triangular formation, the flag displays a zig-zag formation.
The other major difference is within the consolidation period of the two patterns. When displaying the consolidation period, flags use parallel trendlines, while pennants use converging trend lines.
Now let's summarize what we learned throughout this pennant guide.
Pennants are a type of continuation chart pattern. They tend to occur after strong trend moves. The ideal time to trade with a pennant is on confirmation of the breakout after a sudden, sharp move in price.
As the name suggests, the flag pattern takes the shape of a flag, while the pennants display a triangular formation. In addition, the pennants use converging trend lines to indicate consolidation, while flags use parallel trendlines.
Among the many chart patterns in existence, pennants tend to be a lot more accurate than most. Furthermore, this accuracy can be raised with the help of other confirmation indicators.
Many traders employ pennant patterns in their trading strategies. It may be applicable to a wide range of financial markets, including Forex, and can be found at various levels of trends.
This is a pattern that is very easy to spot on a pricing chart if you have trained eyes to analyze price charts. However, there are also some complexities that come when it comes to trading effectively with the pennant pattern.
Although it’s easy to spot this pattern, there are many things you need to know to identify the potential of the breakout and when to enter a trade to maximize your profits. We hope this article will help you improve your trading with pennant patterns.
 Copyright © 2024 IconFX