If you are already involved with forex trading, you must have heard of fractals trading. This is a popular trading strategy used by many massively successful traders and can deliver deep insights to base your trading decisions on.
For those who are interested in using fractals to improve their forex trades, having a clear understanding of what fractals are and how you can use them in trades is important. So in this article, we explore deep into the topic of fractals, fractal patterns, fractal indicators, and more.
While it may seem like the market and the price movements are completely random, this is not the case. Most of the time, with correct observation, you can quickly identify patterns constantly occurring within the market.
When you understand the said patterns well, speculating the future price movements becomes a breeze.
One of the basic types of patterns that take place in the markets is fractals. When a trader is able to identify a fractal pattern, it allows them to predict a high probability of a reversal pattern.
With the correct implementation, fractal patterns can enable traders to predict recurring patterns over a large price movement period.
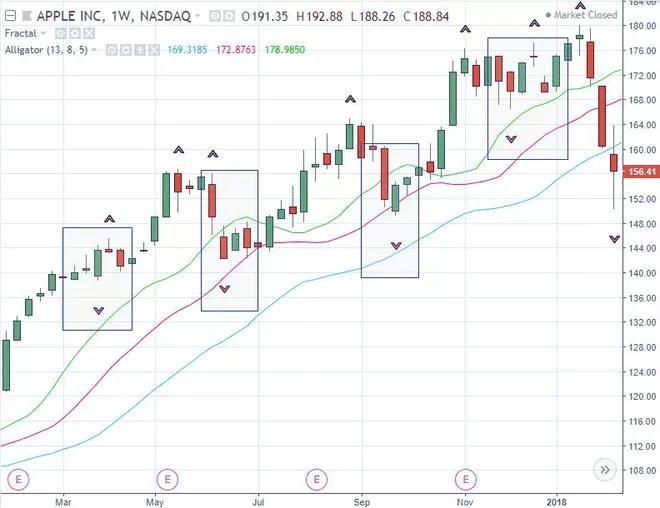
Like many other indicators, fractals also act as indicators on candlestick charts that are able to identify reversal points in the market.
They analyze the daily randomness of the market with the use of technical analysis. In addition, fractal trading also examines the investor horizons and asset liquidity to make accurate speculations.
Among the many pattern indicator methods, fractals trading is one of the few that can effectively function on stable trends. Stable markets appear when the market has various investors that follow the same information stream. One thing to keep in mind here is that this method can be less profitable on a less stable wide fiat.
Fractals trading started as a set of strategies that were crafted with the stock market in mind. When compared with the forex market, the stock market tends to be less volatile and more predictable. So, when integrating fractals trading with the forex market, there is a tendency to be a bit less ideal than in the stock market.
The fractal indicator is one of the many technical indicator tools that traders use to identify price movements and trend reversals. These come with a minimum of five candles that can indicate a bottom or top.
The renowned trader Bill Williams is the man behind the fractal indicators, thus giving it the name Williams fractal indicator. He wrote a book, "Trading Chaos", explaining the fractals trading theory and its origin, which has a link to the mathematical chaos theory.
In simple terms, mathematics explains fractals as recurring patterns. And in the case of trading, fractals are recurring patterns of price movements.
When we take the potential shape of a fractal pattern, it can appear to resemble a "V" or "U" shape on the chart. This V/U shape tends to form if the market is bullish. And if the market is bearish, these can turn upside down and appear inverted.
As we mentioned before, fractal indicators are also all about pattern recognition.
So, like with any other pattern indicator, traders can base their buy or sell decisions according to the discoveries they make from the pattern. Furthermore, this can help traders to identify entries, and exits, stop losses, and gain profits — But with less accuracy than when used in a stock market environment.
The fractal pattern is something traders can identify on both candlestick and bar charts. These generally depict the asset price action over a time period with the help of five candlesticks.
The formation of a fractal pattern directly correlates with the period that the chart is focusing on. For example, if the chart is on an hourly basis, it can take up to five hours for a fractal pattern to form.
There are a few factors to consider when identifying such a pattern to implement fractals trading. Understanding what qualifies as a fractal pattern helps traders to more accurately predict and adapt to the changes in the market.
So let’s look at the fractal qualifiers.
Understanding all of the aspects of fractal trading is important in making more accurate trading decisions. When talking about fractal pattern analysis, there are two forms that every trader should be aware of. They are the fractal reversal patterns and the multiple time frame analysis.
Let's take a deeper look at each of these for a better understanding.
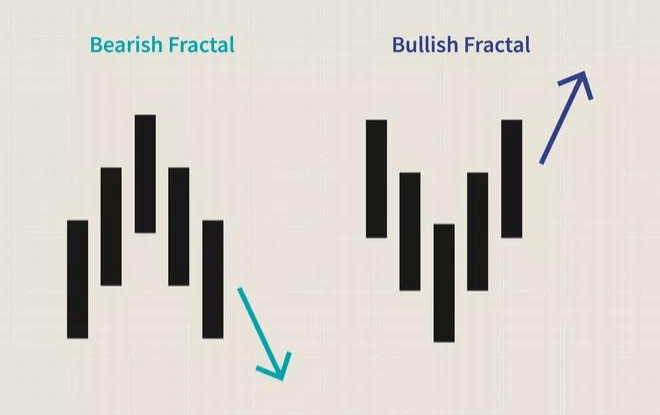
On the fractal reversal side of things, there are two major patterns. They are, and their features are as below.
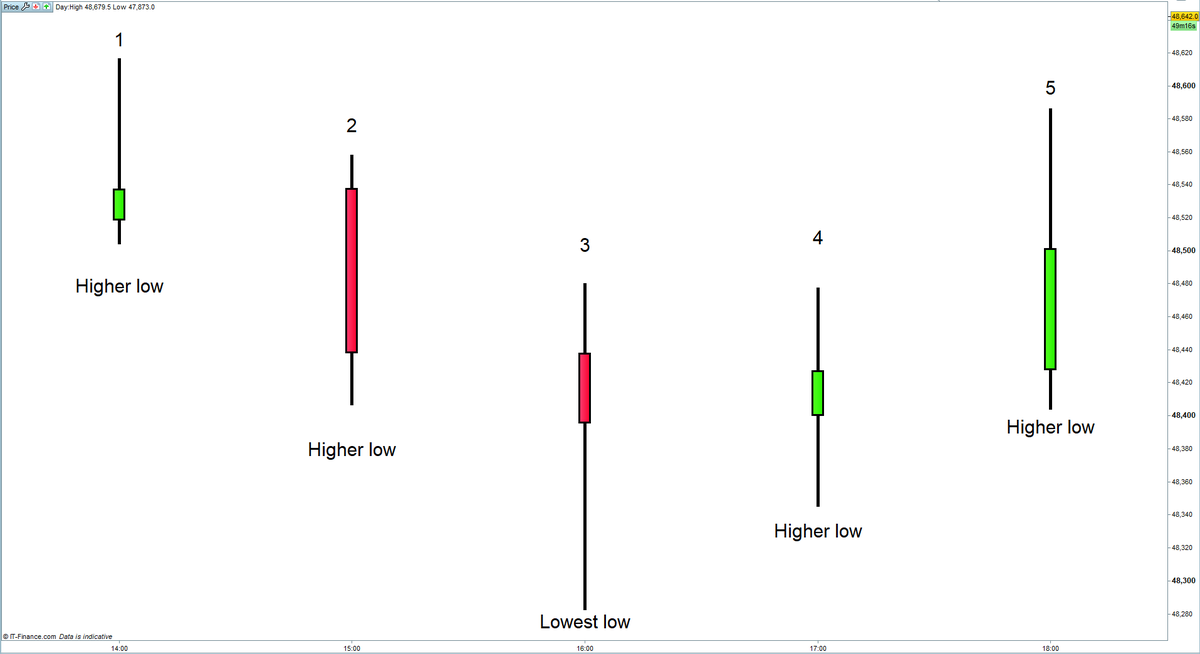
The middle candle is the lowest of lows, and the first two candles come with higher lows than the middle candle. The two final candles also have higher lows than the middle candle. Once these form on a chart, it indicates the end of a downtrend and the beginning of a new uptrend.
With this information, traders can decide either to exit a short-term position or to enter a long-term position. To even further confirm the information, you can use oscillators like the RSI or the stochastic.
The middle candle is the highest of highs, and the first two candles come with lower highs than the middle candle. The two final candles also have lower highs than the middle candle. Once these form on a chart, it indicates the end of an uptrend and the beginning of a new downtrend.
With this information, traders can decide either to exit a long-term position or to enter a short-term position. Just like before, use oscillators like the RSI or the stochastic to confirm this signal.
Another type of analysis to pay attention to is the multiple time frame analysis. Here, traders tend to use a much more fractionalized timeframe than the one they were using to generate much more accurate information.
When using the multiple timeframe analysis, traders get to look at the market from a different point of view. This provides traders with new information that they can use to make decisions.
For instance, for a trader who uses a daily chart, looking at it from hourly periods will allow a new perspective. While the daily chart is capable of providing a bigger picture view of the market, the hourly view can help them fine-tune their entry and exit points.
Let's take a look at the fractal trading strategy example.
To get the most out of fractals trading, traders must first understand what these are and how to use them. Since we already talked about how to understand and identify a fractal pattern, all we have to do is learn how to use them in real-world trading scenarios.
When a fractal pattern forms in a market chart, it signals a high probability of a market reversal.
This can be either a downtrend turning to an uptrend or an uptrend turning to a downtrend. So, in other words, the fractal patterns allow traders to identify the level of price support or price resistance.
The best way to use the fractal patterns is by looking at them in relation to other technical indicators. A great example of this is the daily pivot points.
By doing this, traders can evaluate the strength or probable reliability of the fractal pattern. In addition, this can act as a confirmation method for the trend reversal shown by the fractal pattern.
As with anything, traders can expect both pros and cons while using this method of fractals trading. So let's take a look at some of those to further extend your knowledge of the subject.
You can never be too safe when talking about matters regarding your financial security. Therefore, even with a good understanding of the indicator and its pros and cons, there are a few instances where you should proceed with caution when using a fractals trading indicator.
Here are some words of caution if you are considering using the fractal indicator.
Summary
Fractal trading is the way of trading using fractal pattern indicators to generate accurate speculations.
A fractal indicator is an indicator with good accuracy. With the help of confirmation tools, this accuracy can be improved further.
The fractal pattern comes with at least five candles. The middle candle is always either the highest or the lowest of the pattern.
Having a good understanding of the trend movements and reversals in the market is ideal for any trader. To aid this process, traders can choose from a plethora of tools from both the fundamental and technical analysis sides of things. Among them, one of the better technical indicator tools is the fractal indicator.
With the help of fractals trading, traders can easily predict market behaviors and calculate entry and exit points. Its easy-to-identify nature and timeframe flexibility make it a good choice for beginner traders. Finally, do your own research in addition to this article and find out more ways that you can integrate fractals trading into your trading activities.
 Copyright © 2026 IconFX