Candlestick (long candlesticks/ short candlesticks) patterns are often used to predict the price movement in the market. No matter your experience level and the number of indicators you use, there is so much information about the direction of the price that you can learn from candlestick chart patterns.
So being able to read the candlestick patterns correctly is like a superpower any forex trader can have. But what are candlestick charts that you should know about and how to use them?
We discuss it all in this article. Let's dive in.
In technical analysis, candlestick charts play a prominent role and allow traders to interpret the important information of an asset quickly. These charts become much useful to traders as they provide vital information like the open, close, high, and low of the asset.
In a candlestick formation, each candlestick shows the period of time according to the set timeframe by the trader. For instance, if we are using a candlestick chart on a daily chart, then each candlestick represents a day of the asset in the market.
The main reason for using candlestick charts is to determine the historical price movement of an asset in a given time.
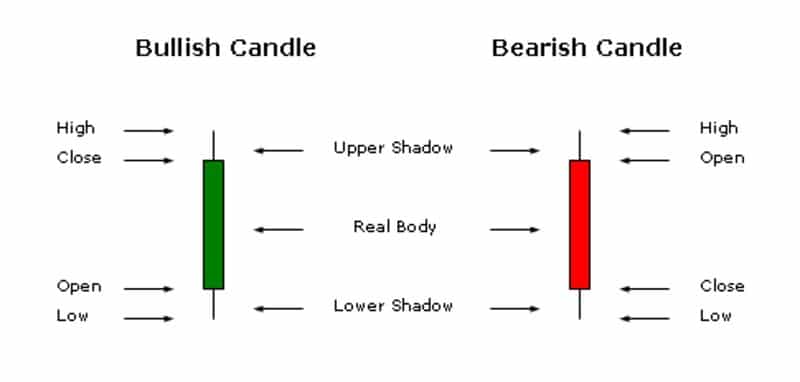
Every candlestick chart comes with three main sections, the body, the wick, and the color. Each of these represents unique information about a particular asset.
Body: The body of the candlestick shows the opening and closing price of the asset. In addition, the endpoints of the body show the opening and closing prices, and this changes depending if the price is bullish or bearish.
In a bearish market, the open will stay above the close, and in a bullish market, the close will stay above the open.
Wick/Shadow: In most cases, every candlestick chart will come with two shadows and shows the high and low price of the asset. While shadows show the intra-day high and low, in the case of high or low coinciding with the open or close prices, shadows become invisible.
Color: Color reveals the direction in which the market is moving. While green or white arrows depict a price increase, black or red color depict a decline in the price.
When understanding the theory behind the candlestick charts, there are three main types of charts that you should know about. Each of these shows different behavior in the market and allows traders to take actions according to them.
These types of patterns show that there is a high probability that the current downtrend is about to reverse to an uptrend. Bullish candlestick patterns can also come as multiple candlesticks or as a single candle.
These types of patterns indicate that there is a high probability that the current uptrend is about to reverse to an uptrend. Bearish candlestick patterns also can come as multiple candlesticks or as a single candle.
Continuation patterns indicate that there is a high probability of the asset price moving in the same direction even after this pattern ends. These types of patterns are also the exact opposite of reversal patterns.
As we discussed earlier, bullish candlestick patterns show a high probability of a downtrend reversing into an uptrend. In instances like this, traders must pay extra attention to their short positions. Here are some of the bullish reversal patterns traders can use to identify downtrends.
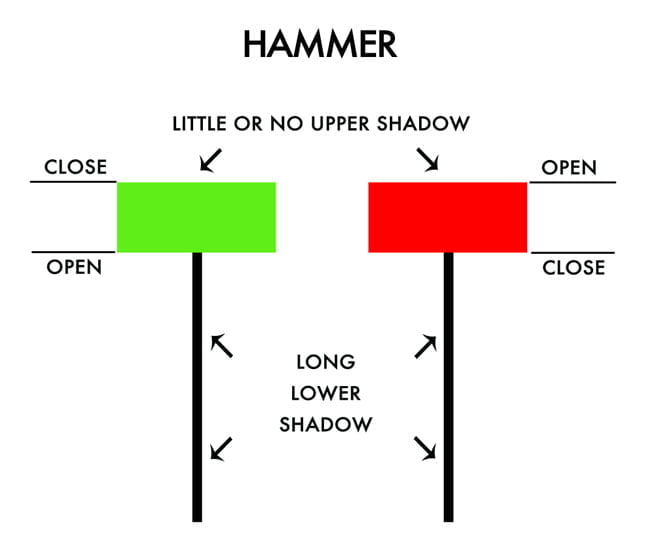
This is a small single candlestick pattern that forms when a downtrend comes to an end while beginning a bullish reversal. The Hammer body is usually at the top with no or little upper shadow. These tend to have lower shadows that are more than twice the size of the body.

This also is a small single candlestick pattern that forms when a downtrend comes to an end while signaling a bullish reversal. The body of the inverted hammer is usually at the bottom with no or a little lower shadow. Another feature of an inverted hammer is its upper shadow, which is more than twice the size of the body.

These types of patterns are made up of three candlesticks and indicate a bullish reversal following a downtrend. The three candles consist of two bearish and bullish long candlesticks and a short Doji candle.

This is another multiple candlestick patterns that forms after a downtrend signaling a bullish reversal. There are two candles within the piercing pattern. The first candle is a bearish candle that signals the continuation of the downtrend, while the other candle shows a bullish reversal.
%22%20transform%3D%22translate(1.2%201.2)%20scale(2.33203)%22%20fill-opacity%3D%22.5%22%3E%3Cellipse%20fill%3D%22%23bc919a%22%20rx%3D%221%22%20ry%3D%221%22%20transform%3D%22rotate(42.3%20-83%20110)%20scale(40.16931%2032.435)%22%2F%3E%3Cellipse%20fill%3D%22%23fff%22%20rx%3D%221%22%20ry%3D%221%22%20transform%3D%22matrix(45.71463%20228.97629%20-28.94433%205.77868%20243.9%2059.2)%22%2F%3E%3Cellipse%20fill%3D%22%2377ffd2%22%20cx%3D%2290%22%20cy%3D%2294%22%20rx%3D%2216%22%20ry%3D%2229%22%2F%3E%3Cellipse%20fill%3D%22%23ffa1c8%22%20cx%3D%2227%22%20cy%3D%2277%22%20rx%3D%2227%22%20ry%3D%2240%22%2F%3E%3C%2Fg%3E%3C%2Fsvg%3E)
This candlestick pattern forms after downtrends and shows the possibility of a bullish reversal. Three white soldiers is a multiple-candle pattern that consists of three bullish long candlesticks with long bodies and no long shadows.
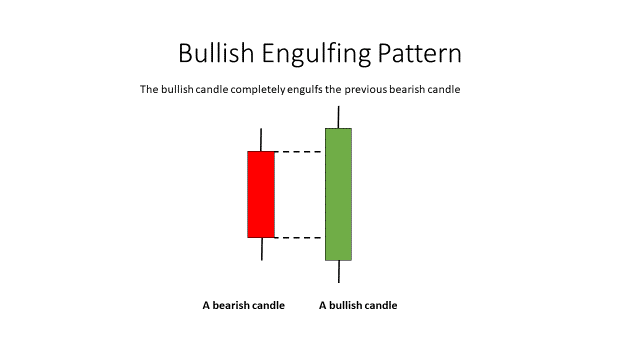
It is another multiple candlestick patterns that tends to form after a downtrend signaling a bullish reversal. This pattern has two candles; one is a bearish candle that shows a downtrend continuation, while the other bullish candle engulfs the first candle denoting the return of the bulls.

Forming at the end of a downtrend, the white Marubozu is a pattern that indicates a bullish reversal. This type of candlestick pattern comes with a long bullish body without any upper or lower shadows.

The Three inside-up patterns tend to form at the end of a downtrend signaling a bullish reversal. This multiple-candle pattern has three candles, with two long candlesticks and a small one in between them. Here the first candle is bearish while the other two are bullish.

The Tweezer Bottom is a pattern that forms at the end of a downtrend that indicates a bullish reversal. This has two candles; the first one is bearish, while the second one is a bullish candle. They both share the same low, and the bullish candle has an upper shadow.
The bearish reversal candlestick patterns show a high probability of an uptrend reversing into a downtrend. In instances like this, traders must pay extra attention to their long-term positions.
Let’s look at some of the bullish reversal patterns traders can use to identify downtrends.
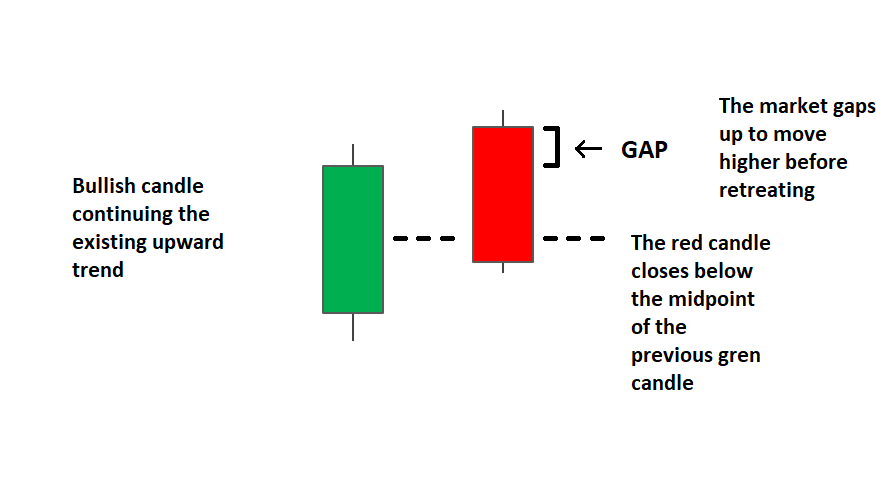
This multiple candlestick pattern forms at the ending stages of uptrends signaling a bearish reversal. The dark Cloud cover has two long candlesticks. The first candle is a bullish one and the second one is a bearish candle.
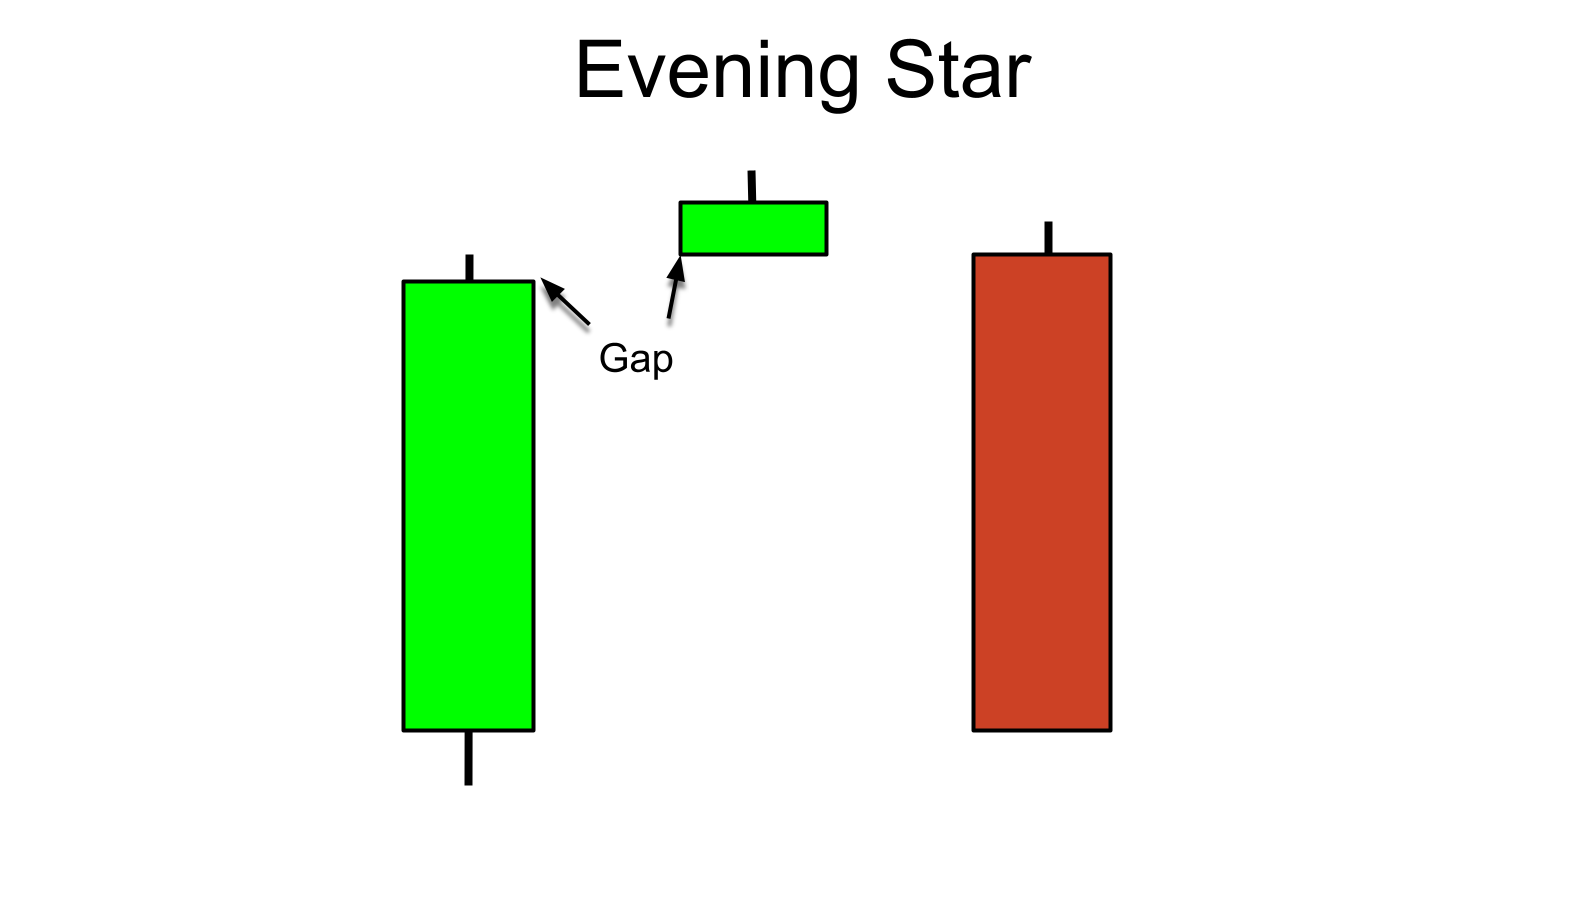
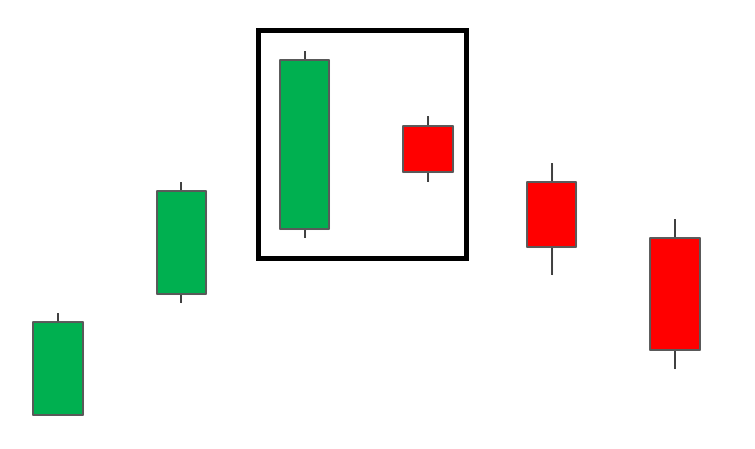
This is another multiple-candle pattern that has three candles and indicates a bearish reversal after an uptrend. The first candlestick indicates the uptrend continuation; the second Doji shows the market’s indecision, and the third bearish candle signals the market reversal.

These types of patterns form at the end of an uptrend signaling a bearish reversal. This has three long candlesticks with bearish bodies and little to no shadows. Moreover, each candle opens within the body of the previous candle.
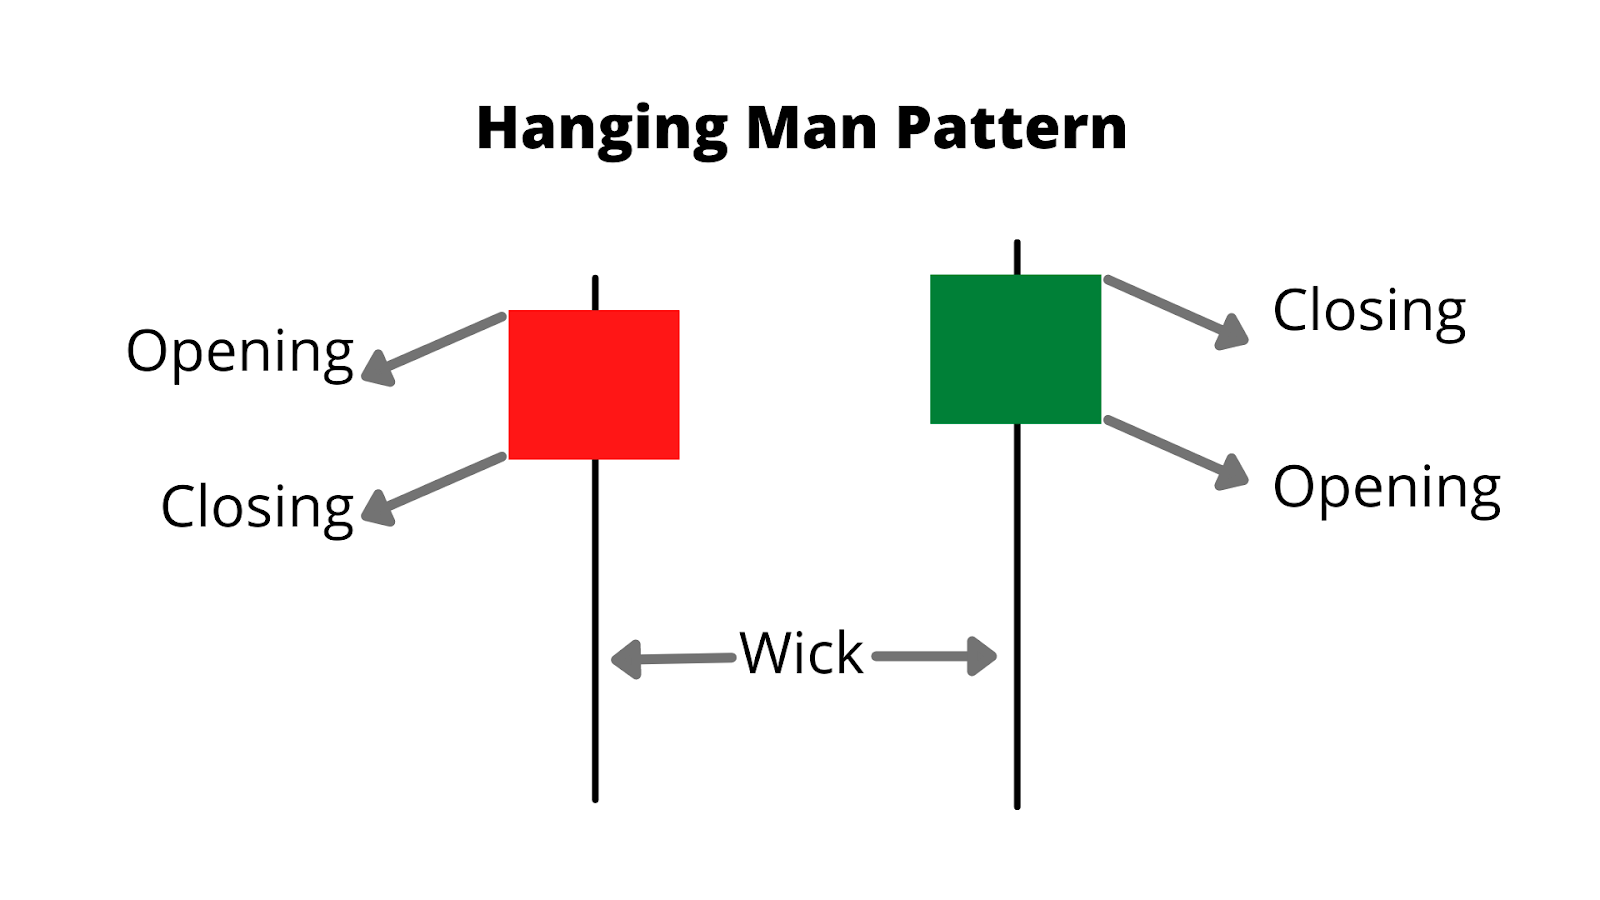
It is a single short candlestick pattern that signals bearish reversal after an uptrend. Further, the body sits at the top with a long lower shadow twice the body's length underneath it with no upper shadow.
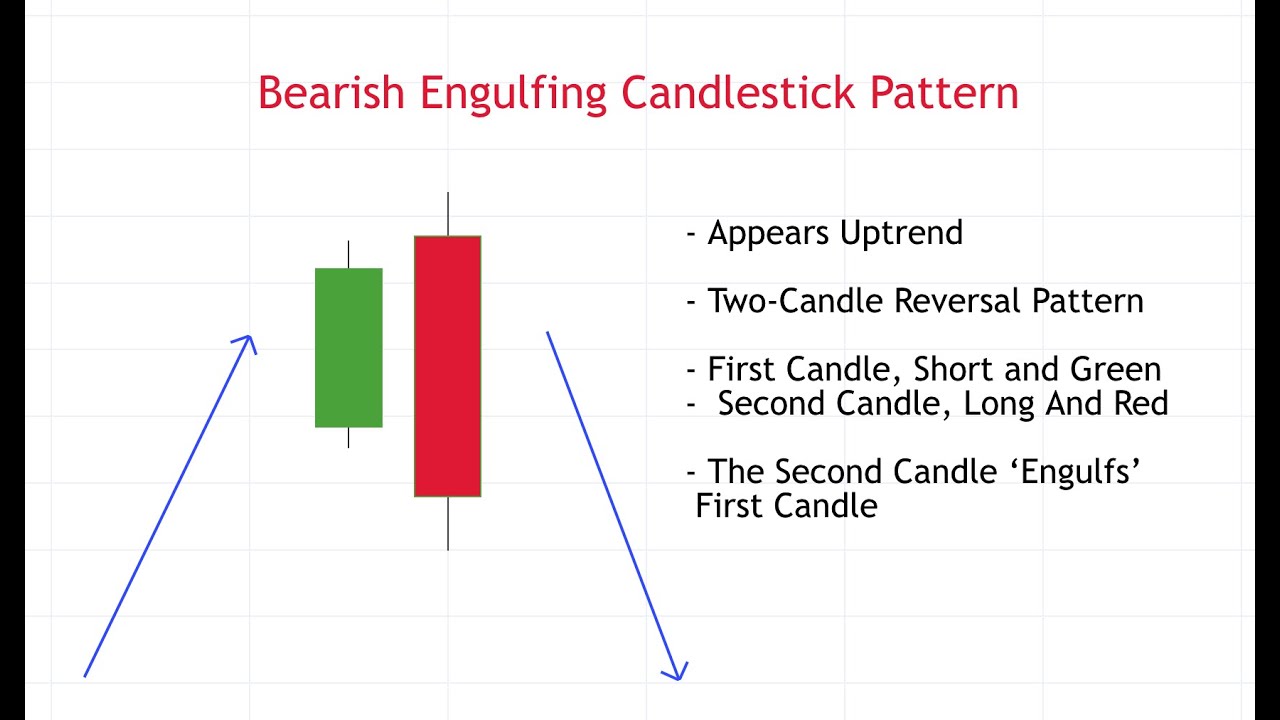
With two candlesticks, the engulfing pattern tends to form at the end of uptrends signaling bearish reversals. The first candlestick is a bullish one that depicts an uptrend continuation. In addition, the second candle is a long bearish one that completely engulfs the first candle.

This multiple candlestick pattern comes with three candles and is a good indicator of a bearish reversal after an uptrend. Out of the three candles, the first one is a short bullish one, followed by long bearish candles that confirm the bearish reversal.
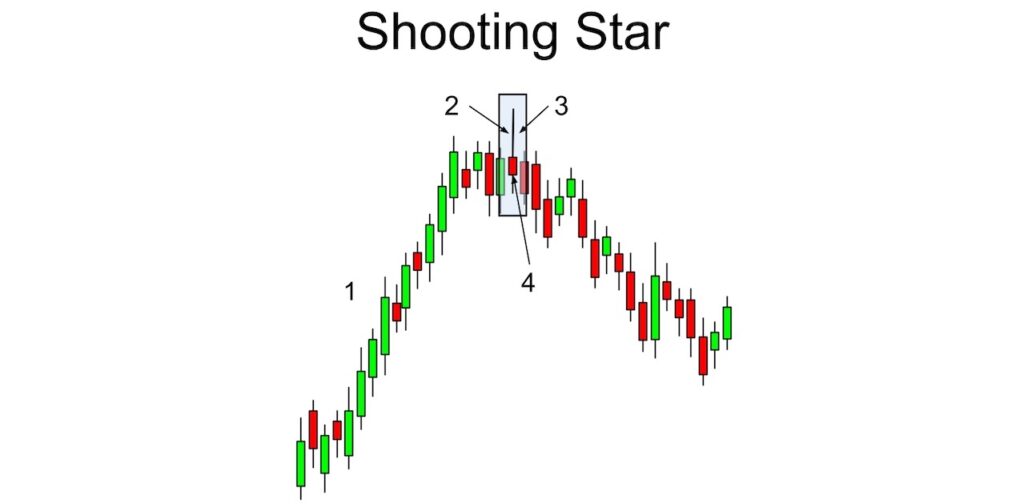
These patterns normally form at the final stage of uptrends and indicate a bearish reversal. The real body of the candle is located at the bottom and has a long upper shadow with little to no lower shadow.
This pattern has two candlesticks, the first one is bullish, and the second one is a bearish candlestick. Both of these share the same high and form at the end of an uptrend to signal a bearish reversal.
This type of pattern forms after an uptrend signals a bearish reversal. Bearish Harami has two candles; the first one is a long candlestick, while the second one is a small bearish candle. Here the second candle must be within the range of the first candlestick.
This type of pattern indicates that there is a high probability of the asset price moving in the same direction even after this pattern ends. Here are the candlestick patterns that fall under the continuation category that every trader must know.
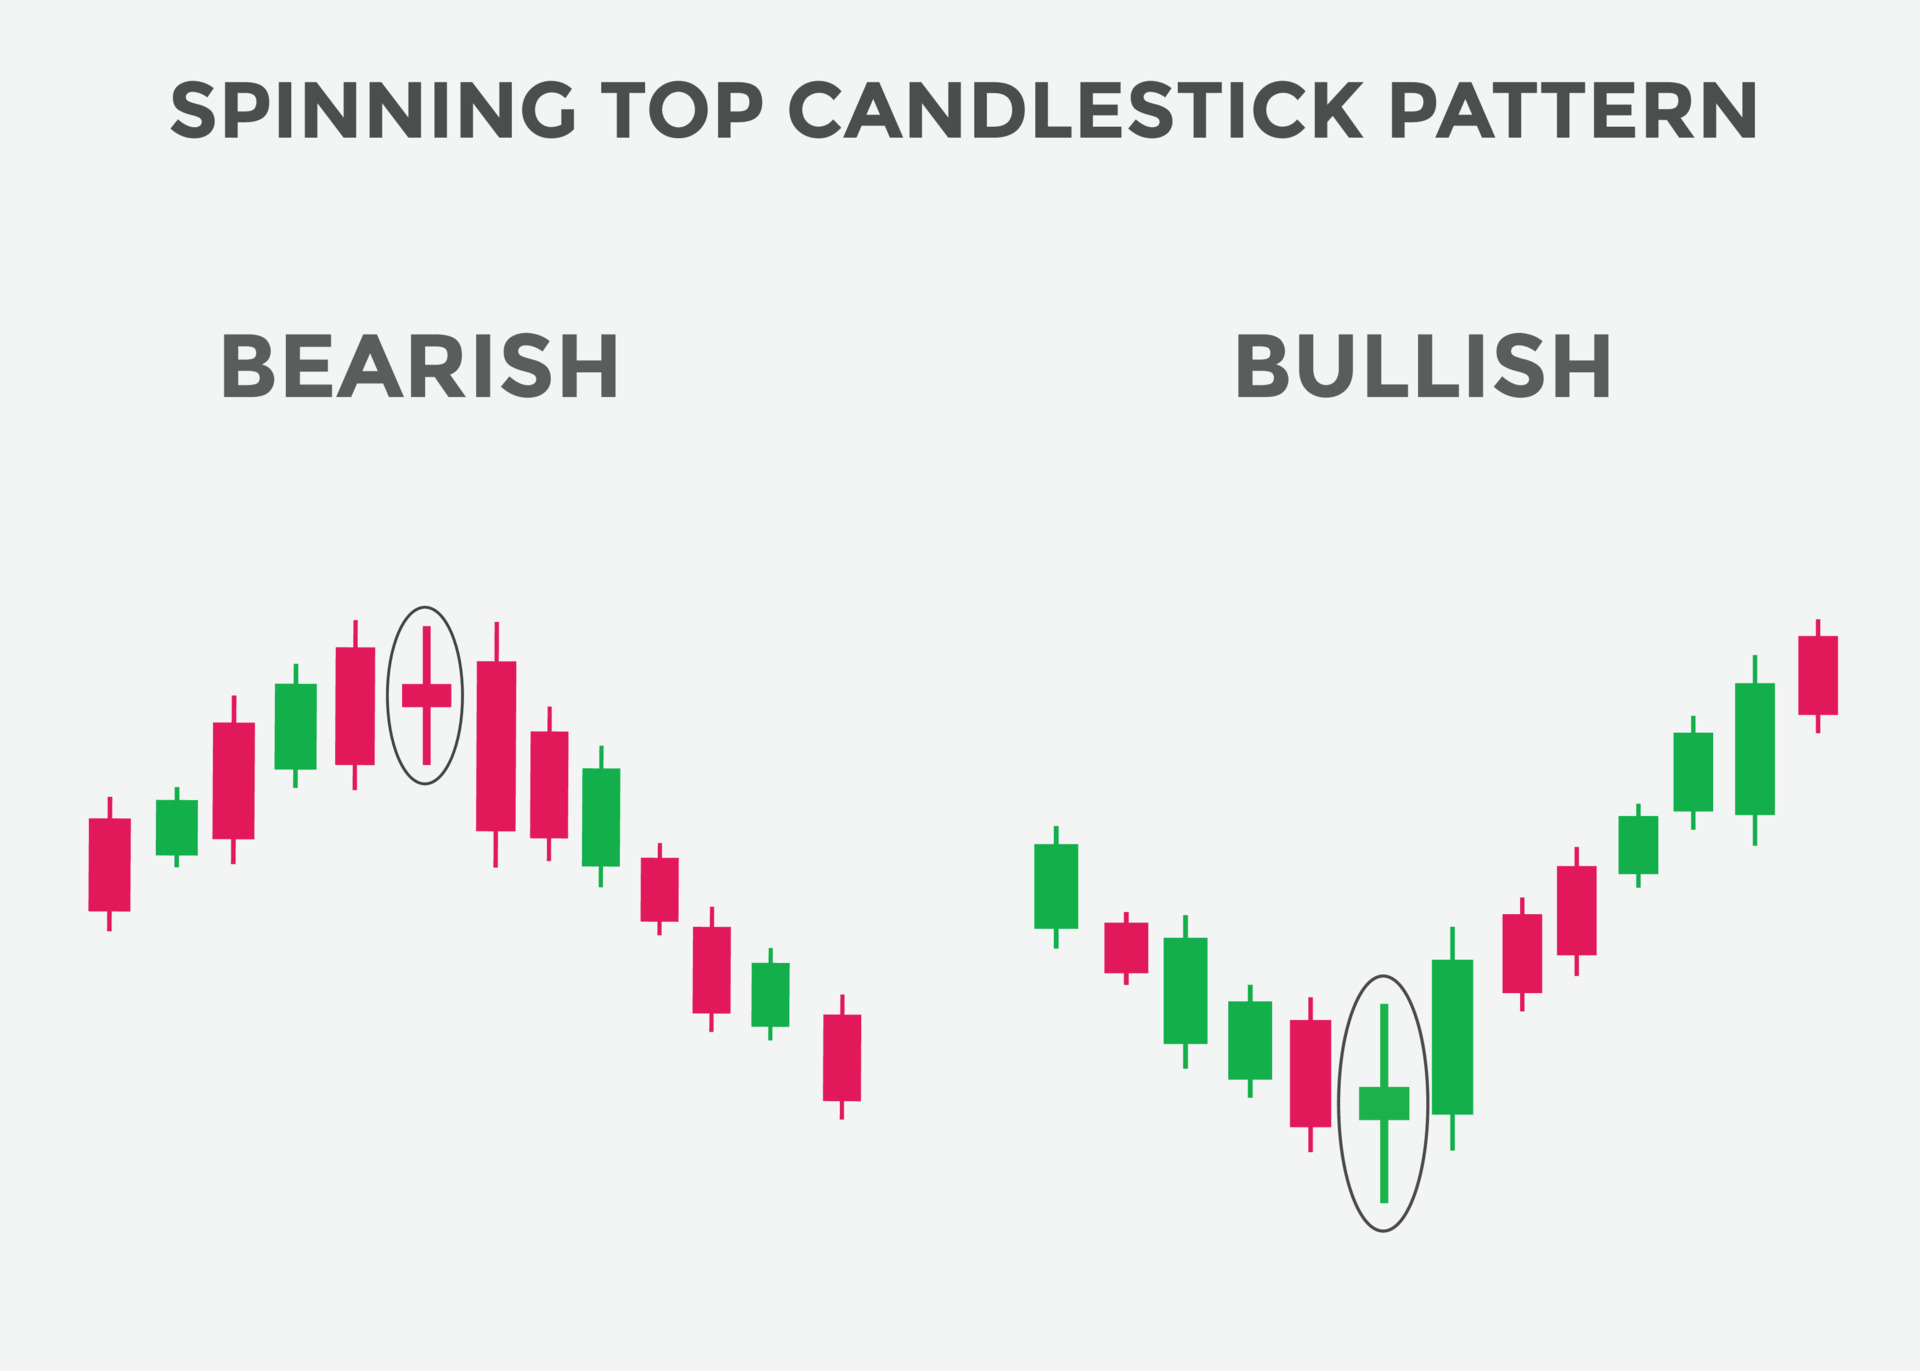
That candlesticks represent indecision in the market. These appear when the opening and closing prices are almost equal. These have smaller bodies and long upper and lower shadows.
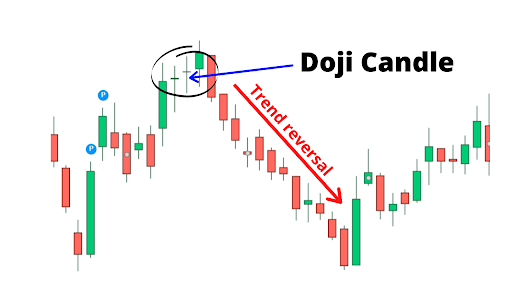
Those patterns are relatively similar to spinning tops and also show market indecision. The difference between Doji and the spinning top is that Doji has a smaller body than the spinning top.
It is a bearish continuation pattern that signals an ongoing downtrend. There are three candles in this pattern, with two being bearish long candlesticks and the last one a bullish candle closing the gap between the first two.
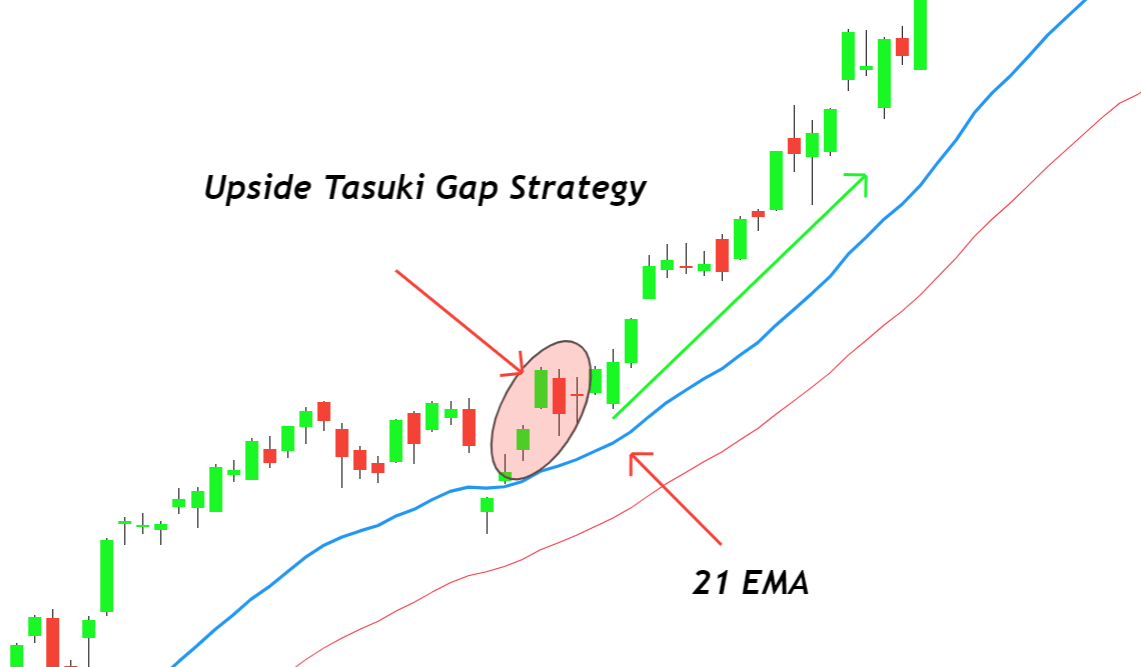
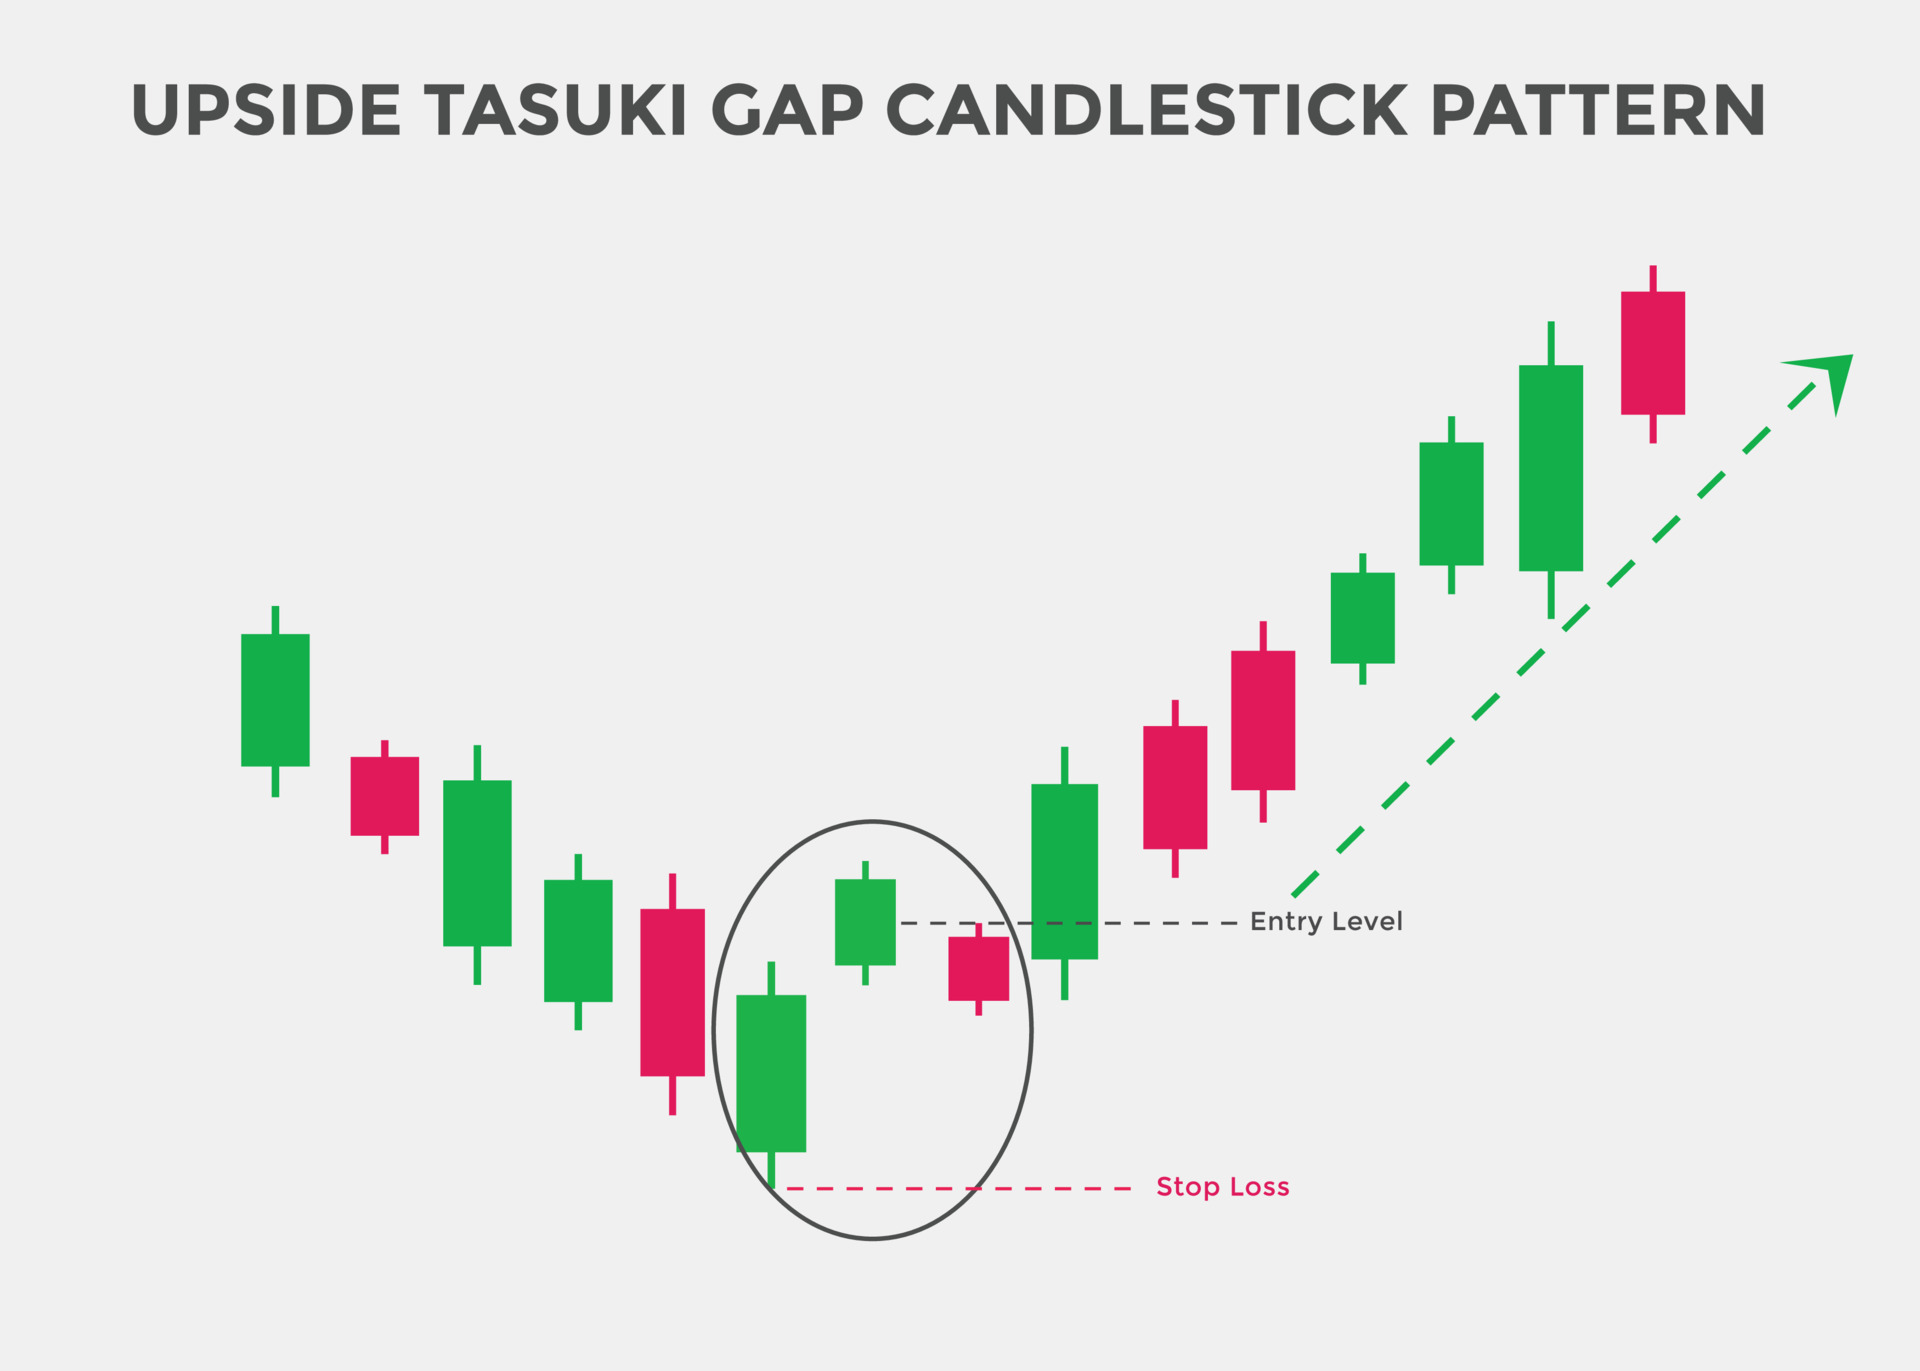
As the opposite of the downside Tasuki pattern, this signals the ongoing uptrend. Moreover, upside Tasuki has two bullish long candlesticks and a small bearish candle closing the gap between the first two.

This is a candlestick pattern with five candles that indicates an interruption of the ongoing downtrend. This has two bearish long candlesticks on both sides and three bullish short candles in the middle.
It is the opposite of the falling three candlestick pattern and comes with two bullish long candlesticks on the sides with three small bearish candlesticks in the middle.
It is another pattern with five candlesticks that indicates the continuation of a prior trend. Keep in mind that there are both bullish and bearish Mat Holds. For instance, the bullish pattern, which denoted an uptrend, starts with a bullish long candle followed by a gap higher three smaller candles that move lower. The final candle is again a bullish long one that moves up.
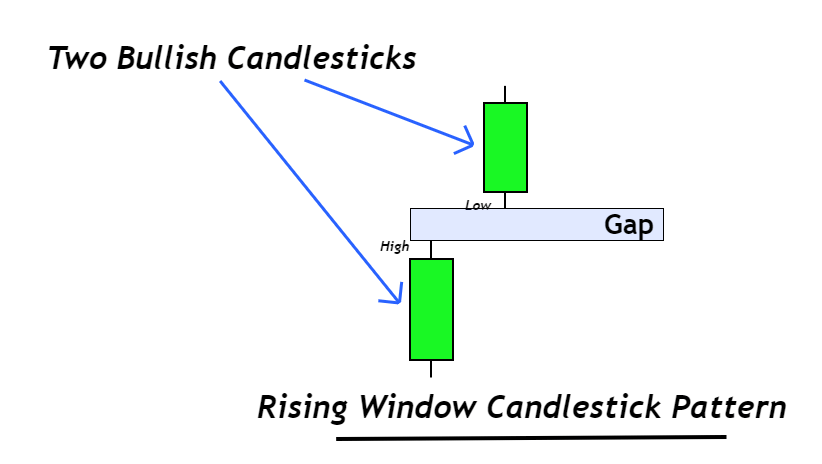
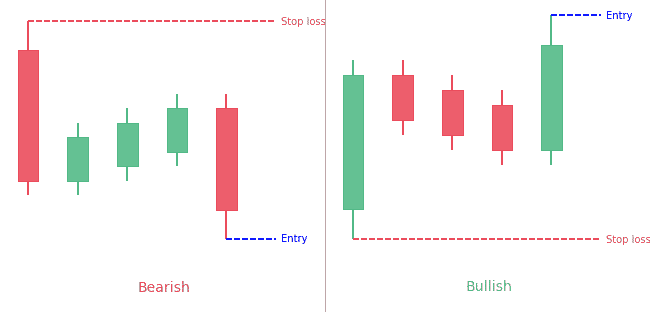
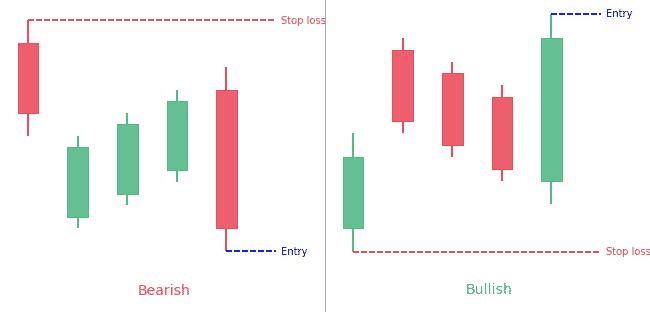
This is a pattern with two bullish candlesticks with a gap in between that signals a trend continuation. The gap also shows the space between the high and low of two candlesticks.
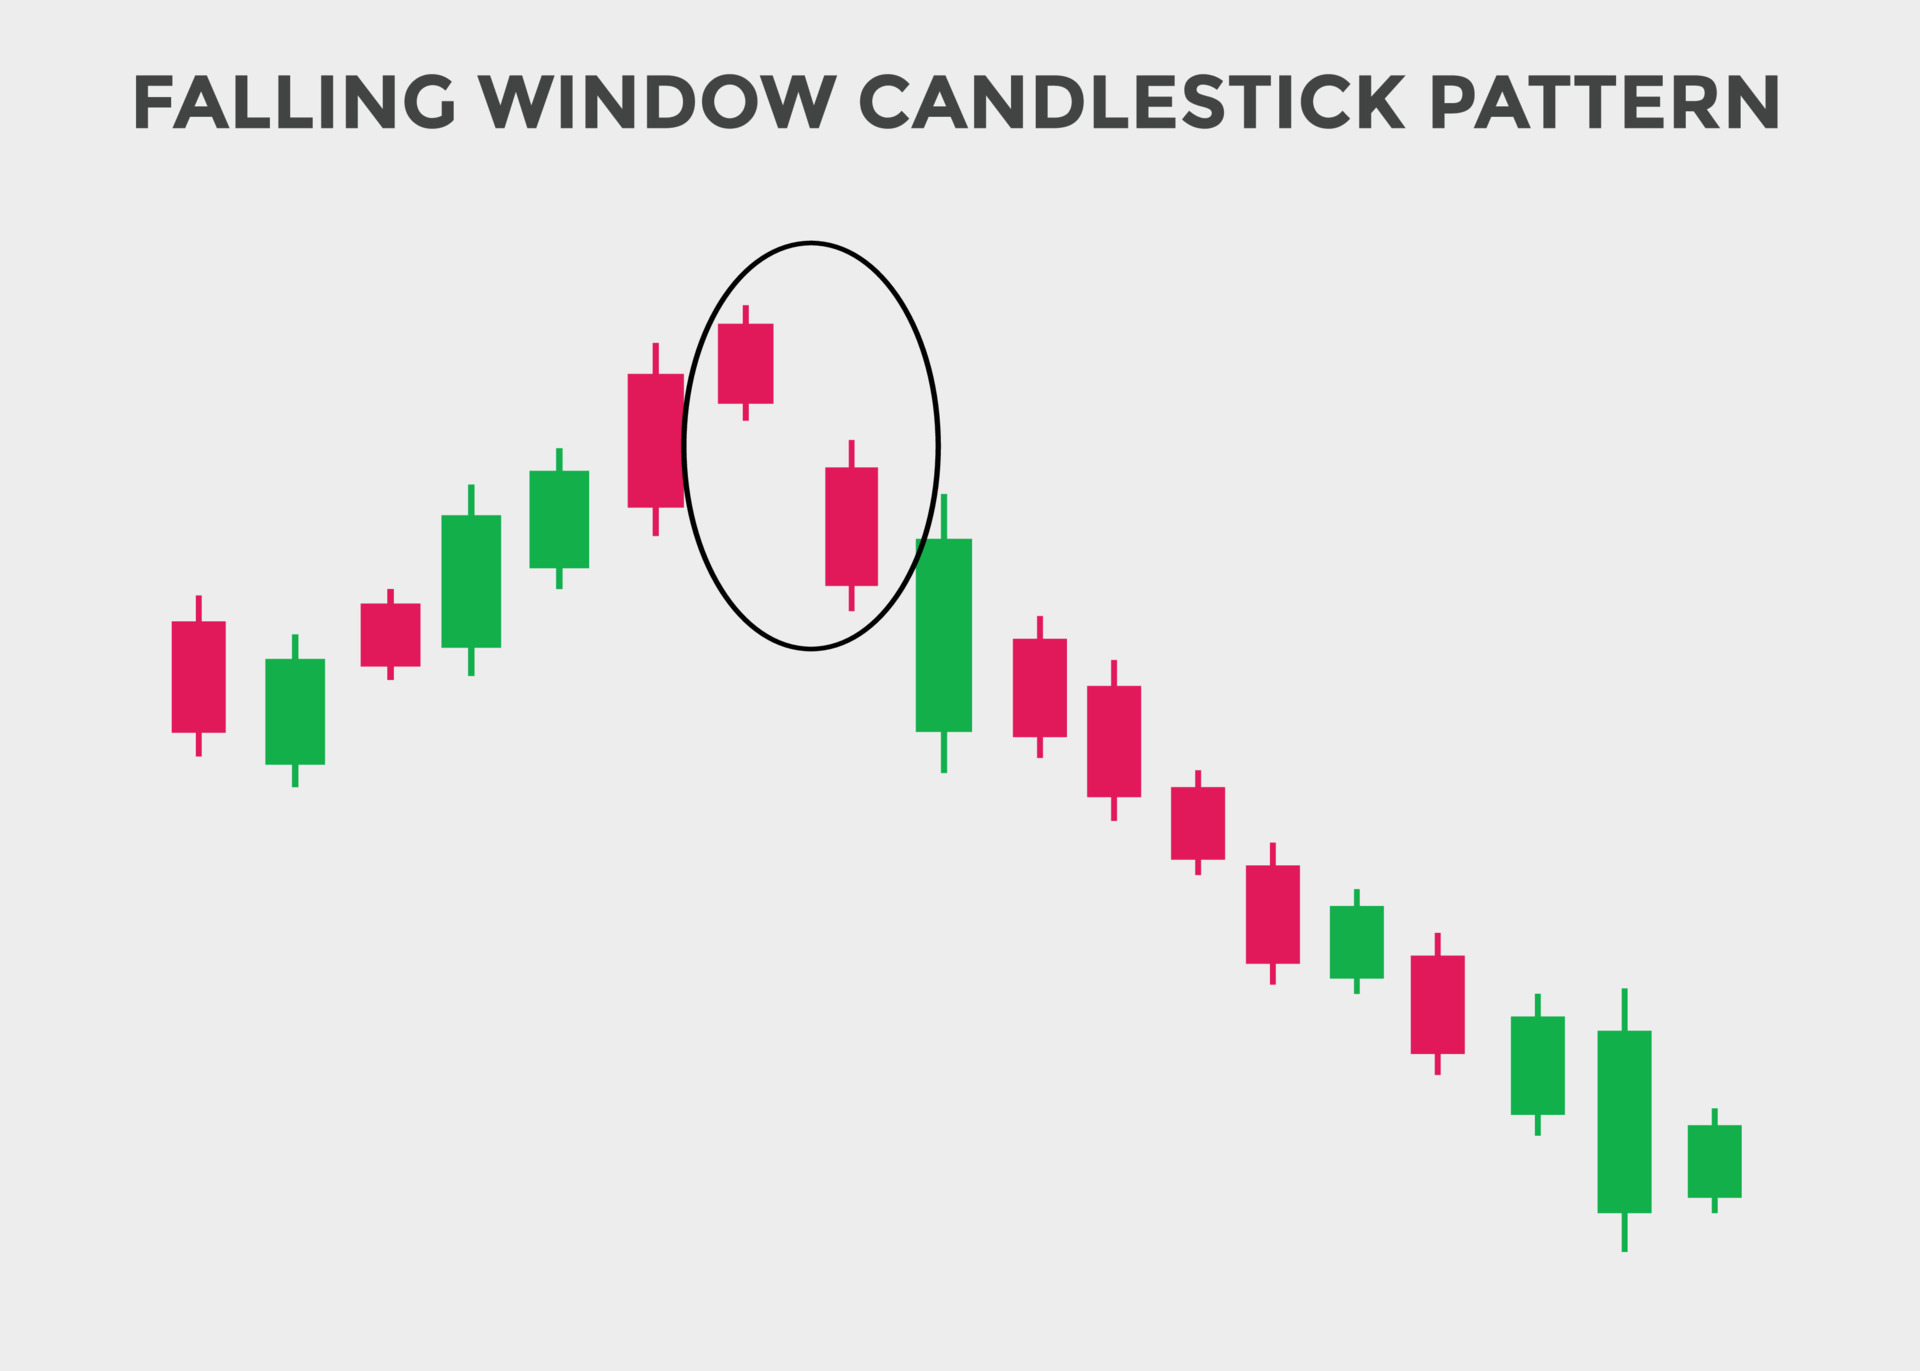
This is a pattern with two bearish candlesticks with a gap in between that signals a trend continuation. The gap is the space between the high and low of two candles.
Candlesticks are vital to interpreting market trends as candlestick charts allow traders to determine the movement of the asset price using prior patterns. With the candlestick data, you can decide when to open long or short positions or when to exit the market accurately.
So any trader that is keen on using technical analysis to back their trade decisions can make the best use of candlestick patterns.
Another benefit of candlestick charts is that you can learn them easily if you are just a beginner. No matter what type of trading strategy you use, candlestick information of a market will help you well-educated trades for better profits.
Among the technical indicators, candlesticks tend to be some of the most accurate patterns. However, it is wise to use another indicator to confirm your findings.
While most patterns show similar returns, Three White Soldiers and Three Black Crows tend to be the most used.
Candlestick patterns allow traders to accurately predict the price movements of assets. This can help traders to know when to open long or short positions.
As one of the most accurate indicators of asset price movement, candlestick patterns are something that every trader should use.
Accurately speculating on the price movement allows traders to increase their chances of finding success in their trades — And candlestick patterns are one of the best ways to do that.
However, even if candlestick charts provide accurate information, it is wise to use another technical indicator to confirm the findings of the candlestick patterns. This way, you won't have to second guess your positions in the market, further improving your chances.
 Copyright © 2026 IconFX