Education • Spinning top Candlestick: How to trade with it?
Candlesticks and price action plays a huge role in making good trading decisions. When it comes to learning about candlesticks, the spinning top candlestick is one of the most significant candlesticks that tells you a lot about what’s going on in the market. It gives insights into what’s happening to the price in the market right now and what might happen in the future.
No matter whether you are involved with short-term or long-term trades, knowing about this candle will help you understand the market better. In this article, we share all about the spinning top candlestick and its uses.
Candlestick charts are a vital part of the technical analysis that helps traders to anticipate the price movements within the market. Their visual representation gives a complete overview of how the price has moved over a given period.
This type of chart consists of many different candlesticks, and one of them is the spinning top candlestick.
A spinning top candlestick is a candlestick formation that provides information on uncertainty about the future price direction of a selected asset. Most of the time, this leads to a price trend reversal of the asset in question.
The indecision in the market with neither buyers nor sellers having the upper hand is depicted by the small body of the candlestick.
Moreover, these are most commonly seen when the market is facing an uptrend or a downtrend. In addition, there is a small possibility that a spinning top candle will form in the middle of a trend, showing further consolidation.
The backdoor information that this formation provides can be crucial for traders to predict the market's future price movements.
When read with the other candlesticks of the chart, the spinning top candle provides solid information about the price movement in the market, which you can use to make your trading decisions.
[elementor-template id="8318"]
New to trading? Try out our free demo, learn candlestick patterns and test your predictions.

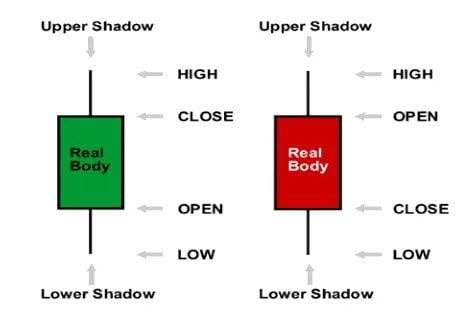
A spinning top candlestick consists of three main components. Each of the components provides vital information about the future price movement. So understanding them is the first step toward understanding how to read the spinning top candlestick in a chart.
The upper shadow is the line sticking out at the top end of the body that connects the highest price of the asset within the set time frame with the real body. The tip indicated the highest prices the asset has reached.
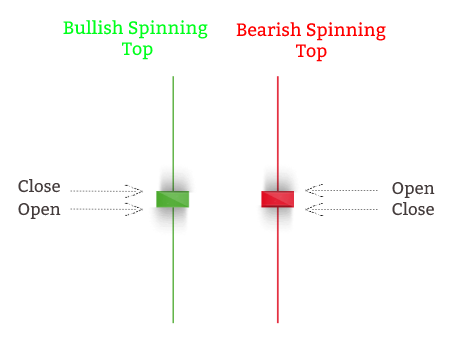
The small real body shows the gap between open and closed prices. Often spinning top candles have a very small body. This is because when such a candlestick is formed the open and closed prices are not far from each other.
Opposite the upper shadow is the lower shadow which connects the lowest price of the asset with the real body. Here the lowest point of the line denoted the lowest price point.

The color of a candlestick also provides vital information when it comes to a spinning top.
If the candle is red, then the candle’s open price is lower than its closed price. In a green spinning top, the closed price is lower than the open price.
In simple words, the spinning top candlestick is a good indication of potential price indecision in the market. However, there are so many other details a spinning top candlestick can tell. Below are some of them.
Important: The spinning top candlestick can behave differently depending on the current trend within the market. Understanding the difference between how the candlestick behaves on an uptrend and a downtrend can give traders valuable information that they can use to make better trade decisions.
In the case of an asset having an uptrend on the market, the total control falls into the bulls. The main reason for this is that the bulls keep raising the prices of the asset.
In uptrend scenarios like this, the spinning top candlestick shows that there is a possibility of bulls consolidating their position.
In addition, spinning top charts on an uptrend can show the bears' failed attempt at lowering the prices. If the attempt was successful, the candle would be a long red one.
So the two potential outcomes of the spinning top candle in an uptrend are,
In downtrend scenarios of the market, the spinning top candlestick behaves a bit differently. This happens due to bears having complete control as they keep lowering the asset’s price. When this happens, this candlestick chart shows that there is a possibility for bears to consolidate their position.
Furthermore, spinning top charts on an uptrend can show the bulls' failed attempt at raising the prices. Here if the attempts bulls took were successful, the candle will be a long green one.
As with the uptrend, there are two possible situations that can happen when a spinning top candlestick appears in a downtrend.
Important: When the spinning top candlestick forms at the end of a bearish trend, it can signal the end of the current trend or the beginning of a new uptrend.
If the spinning top candle forms at the end of a bullish trend, then it shows the end of the current trend and movement toward the bearish direction.

Another candlestick formation that looks similar to the spinning top is Doji. Both of these are important candle formations and show indecision in the market. In addition, both of these candlesticks come with the ability to depict a potential price reversal of the current trend in the market.
However, there are a few differences that every trader must know to identify each of the candlesticks separately.
Let's look at the visual differences between the two.
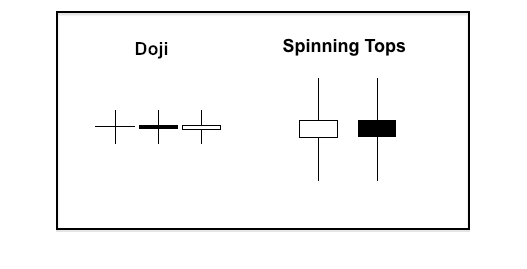
Firstly, the Doji formation looks like a cross with long upper and lower shadows and a very short body (line-like body).
In a Doji, the opening price becomes identical to the closing price, hence the short body. This candle might look like a cross, inverted cross, or a plus sign, depending on the lengths of the upper and lower shadows.
When comparing Doji with a spinning top candlestick, the spinning top has long shadows and a longer candle body.
The appearance of both Doji and the spinning top candlestick can happen anytime, in any timeframe, to any asset in the market. Both of the candles are neutral when considered alone but can give you a lot of signs when read with their previous and next candles in the chart.
When there is a higher possibility of a trend reversal, both Doji and spinning top candlesticks will be followed by a strong move in the opposite direction of the current trend.
Being able to distinguish a Doji formation from a spinning top correctly means that you possess enough knowledge to get the most use of these formations.
The first step in trading with the spinning top candlestick formation is understanding what it tells you about the market. When you have a clear grasp of it, you will be able to easily figure out where it stands and the relation the chart has with the overall market trends.
When there is a formation of the spinning top candlestick in the market, it is wise not to enter trades. You must wait and see how the next candlestick forms. However, it’s always better if you use another signal from a reliable source for confirmation.
Traders can use technical indicators, fundamental indicators, or oscillators to confirm the price movement direction. Some of the best trading indicators that traders can use for confirmation are,
Pro Tip: Use more than one indicator to get more accurate information about the market. This will help in making the best possible trading decision.
Most expert technical traders tend to wait for the formation of the succeeding candle to confirm the trend reversal. This allows no room for error as the way the market progresses is not going to change. If this confirmation does not exist, the trend reversal is not guaranteed. Therefore uncertainty remains in the market.
The most important factors to consider when using the spinning top candlestick are,
Pro Tip: The spinning top candlestick formation shows the indecision between buyers and sellers that can directly lead to a price reversal. The spinning top becomes most effective in key price levels of support and resistance, and it is wise to keep an eye out for those levels.
A spinning top candlestick doesn’t lead to a single market outcome every time. Thus it alone isn’t enough to understand the market movement. While it provides an excellent overview of the price direction of an asset in the market, it also comes with a few limitations that can make a trade go sideways.
Even with its frequent appearance, spinning tops can appear during sideways movements, resulting in price leading nowhere.
The more you see a spinning top in a pattern, the higher unpredictability of the price movement. The only way to get around this issue is to be selective of what spinning tops you choose to trade with.
Another drawback of the spinning top candlestick is the higher requirement of confirmations. Among all of the candlestick formations, the spinning top requires the highest level of confirmation.
Important: Having a solid price movement confirmation method is beneficial to any trader, regardless of the candlestick formation considered. But even with indicators providing you with confirmations, there is no 100% guarantee on the direction of the price movement.
This makes speculating on whether the price will reverse or if it will go in the same direction as the current trend harder than one might think.
The final limitation that the spinning top candlestick comes with is its long upper and lower shadows. This forces traders to place wider stop-loss orders to protect their finances in case the market moves against their opening positions.
In addition, this can lead to a less-than-ideal risk-to-reward ratio as the trader will have to take on higher risks to earn a smaller reward.
To bypass this issue, traders will have to seek the help of multiple time frame analyses. So, timing the market as best as you can is the easiest way to bend the risk-to-reward ratio in your favor.
It is a technical analysis tool that helps traders to anticipate the price movements within the market. It also signs potential indecision in the asset.
Spinning top candlestick is one of the most accurate prediction tools. However, it is wise to use other confirmation signals to verify its results.
Candlestick charts are technical tools for trade analysis. They display candles on the given chart, which indicates price action.
To be on top of the forex game, you will have to make the most use of all the available tools at your disposal. Since anticipating price movements of the assets play a large role in the success of the trades, the Spinning top candlestick is one of the most important candlestick formations that you should know about.
With the help of the spinning top candlestick, traders can have a better understanding of the future price movement. Knowing about the potential price indecision of the asset can help traders to decide what their next move is going to be.
We hope that this article has all the things that you need to know about the spinning top candlestick so you can use it to improve your trading.