Iran: $100B Unfreezing of Tehran’s Funds Is the Last Critical Sticking Point in US Talks
Table of Contents
Iran: $100B unfreezing of Tehran’s funds as the final barrier in US negotiations
Iran: $100B unfreezing of Tehran’s funds has emerged as the final and most sensitive obstacle in ongoing negotiations between Iran and the United States. While both sides have reportedly made progress on nuclear restrictions and regional de-escalation, the issue of releasing Iran’s frozen overseas assets continues to block a final agreement.
This financial dispute is not just diplomatic, it is shaping oil prices, forex volatility, and global risk sentiment.
Iran: $100B unfreezing of Tehran’s funds and why it matters
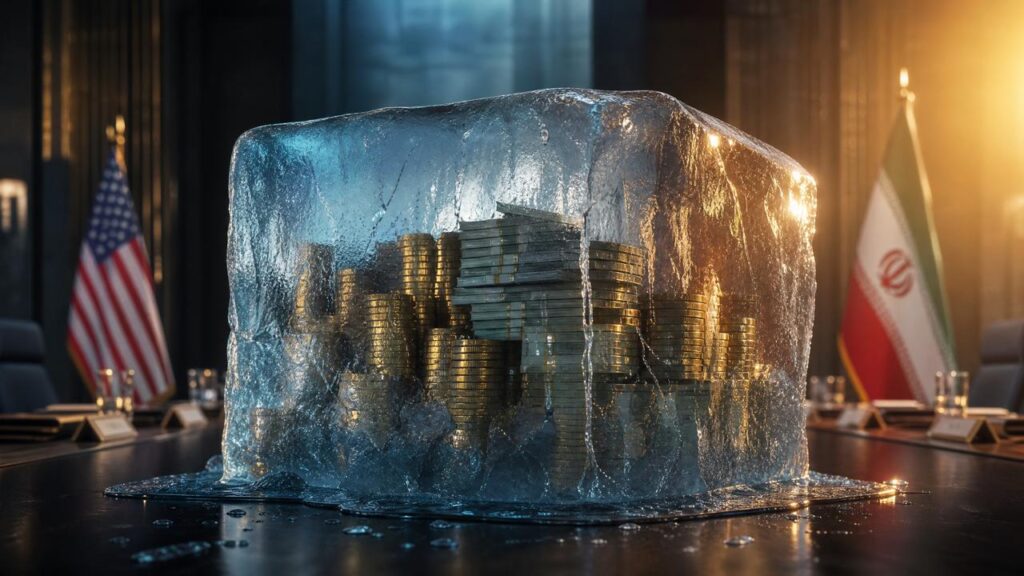
At the center of the dispute are billions of dollars in Iranian assets frozen in foreign banks due to long-standing sanctions.
Estimates vary, but total blocked funds could exceed $80–100 billion, depending on how reserves and oil revenues are calculated. These funds are critical for Iran’s economy, particularly for stabilizing its currency and funding essential imports.
For Iran, the Iran unfreezing of Tehran’s funds issue represents:
- Economic survival
- Inflation control
- Restoration of trade access
- Political stability
For the US, however, it represents leverage tied to compliance and security guarantees.
Why frozen Iranian assets became a global issue
The frozen assets originate from years of sanctions restricting Iran’s ability to access global banking systems.
According to analysis from the Brookings Institution, sanctions enforcement has historically been one of the most powerful financial tools in geopolitics.
Iran’s blocked funds are mostly held in countries such as South Korea, Iraq, and other trade partners where oil revenues accumulated but could not be repatriated freely.
A breakdown of the situation shows:
- Oil revenue trapped in foreign accounts
- Restricted SWIFT banking access
- Limited ability to convert foreign currency reserves
These constraints have made Iran unfreezing of Tehran’s funds the most important bargaining chip in negotiations.
US vs Iran: the core disagreement
The current negotiations revolve around how the funds should be released.
US position:
The United States supports a phased release system, meaning funds would be unlocked gradually based on compliance milestones.
Reports suggest initial access could involve only a portion of total assets, possibly linked to verification stages.
Iran’s position:
Iran is demanding:
- Immediate access to a larger share of funds
- Fewer restrictions on usage
- Guaranteed economic relief without delays
This disagreement has turned the financial clause into the final sticking point in the talks.
Market impact: oil, forex, and risk sentiment
The Iran: $100B unfreezing of Tehran’s funds issue is not just diplomatic, it directly affects global markets.
Traders are watching closely because:
- Oil prices react to Middle East risk premiums
- USD volatility increases on geopolitical headlines
- Safe-haven flows shift between gold and dollar assets
For traders following macro trends, updates on Iran-US talks often act as short-term volatility catalysts.
In forex markets, the USD tends to strengthen during uncertainty and stabilize when diplomatic progress is made.
What happens next in negotiations
The direction of talks now depends entirely on whether both sides can bridge the gap between:
- Immediate financial relief (Iran’s demand)
vs - Conditional phased release (US demand)
Diplomatic sources suggest that while most technical issues are near agreement, the financial component remains unresolved.
If progress is made on unfreezing of Tehran’s funds, markets could quickly shift into risk-on sentiment. If talks fail, volatility in oil and forex markets could spike again.
Final thoughts
The Iran: $100B unfreezing of Tehran’s funds has become more than a financial issue, it is now the defining test of trust between Washington and Tehran.
It sits at the intersection of geopolitics, global trade, and financial markets. Until this final issue is resolved, no broader agreement can be fully secured.
For traders and investors, this means one thing:
geopolitical headlines from these negotiations will continue to drive volatility in oil, USD pairs, and risk sentiment in the weeks ahead.